

Question: Model results: Interpreting the data After Hawkins team had decided which variables to include in the model, they needed to gather the data to generate
Model results: Interpreting the data
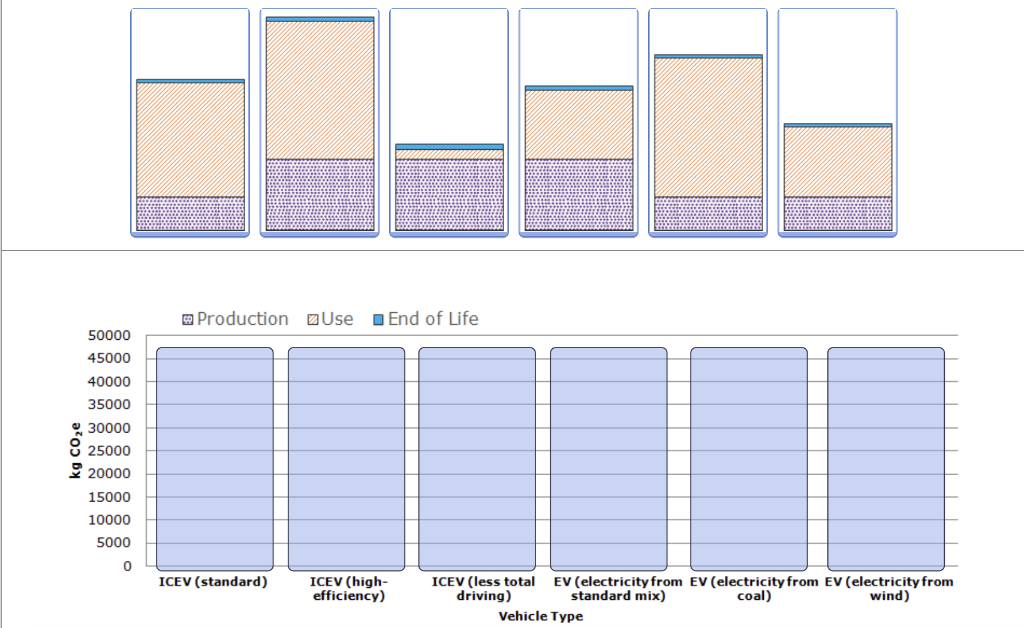
After Hawkins team had decided which variables to include in the model, they needed to gather the data to generate values for those variables. They calculated the CO2 emissions associated with every part of the vehicle. They determined how many miles a typical vehicle is driven during its lifetime (150,000 km). And they looked at the CO2 emissions from various forms of electricity generation. Ultimately, they presented the total costs associated with three life cycle phases: production, use, and end of life. Below is a table with data representative of, but not taken from, Hawkins research. (Note that the units, kg CO2e, refer to kilograms of carbon dioxide equivalent, a measure of global warming potential.)
| Production | + | Use | + | End of Life | = | Total Life Cycle | |||||||||
| Battery Materials Extraction and Manufacturing (kg CO2e) | Vehicle Materials Extraction and Manufacturing (kg CO2e) | Production Total (kg CO2e) | kg CO2e per 1000 km driven | 1000s of km driven | Use Total (kg CO2e) | End of Life Total (kg CO2e) | |||||||||
| ICEV (standard) | 0 | + | 7500 | = | 7500 | 200 | x | 150 | = | 30000 | 750 | ? | |||
| ICEV (high-efficiency) | 0 | + | 7500 | = | 7500 | 165 | x | 150 | = | 24750 | 750 | ? | |||
| ICEV (less total driving) | 0 | + | 7500 | = | 7500 | 200 | x | 75 | = | 15000 | 750 | ? | |||
| EV (electricity from standard mix) | 8000 | + | 7500 | = | 15500 | 100 | x | 150 | = | 15000 | 1050 | ? | |||
| EV (electricity from coal) | 8000 | + | 7500 | = | 15500 | 200 | x | 150 | = | 30000 | 1050 | ? | |||
| EV (electricity from wind) | 8000 | + | 7500 | = | 15500 | 15 | x | 150 | = | 2250 | 1050 | ? | |||
Calculate the total life cycle kg CO2e for each of the six vehicles. Use those total values along with the values for each portion of the life cycle to help you drag the bars to their correct places on the bar graph.
Step by Step Solution
There are 3 Steps involved in it

Get step-by-step solutions from verified subject matter experts