

Question: Model the electric fields created by charge distributions and the effect that electric fields have on charged particles Use vector representations (graphical, column vector)
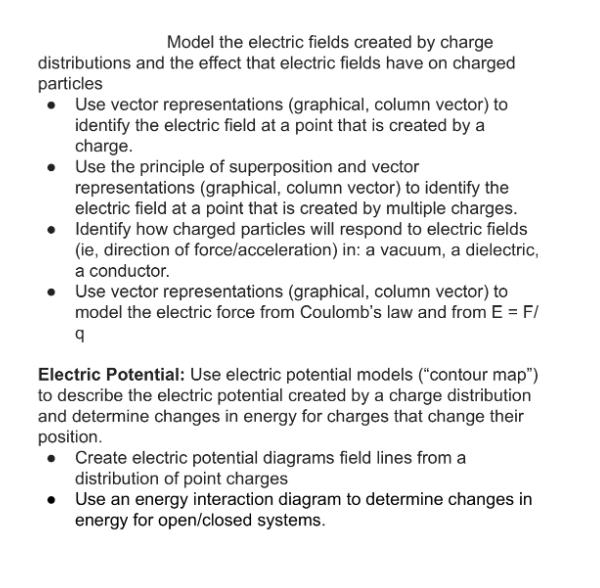
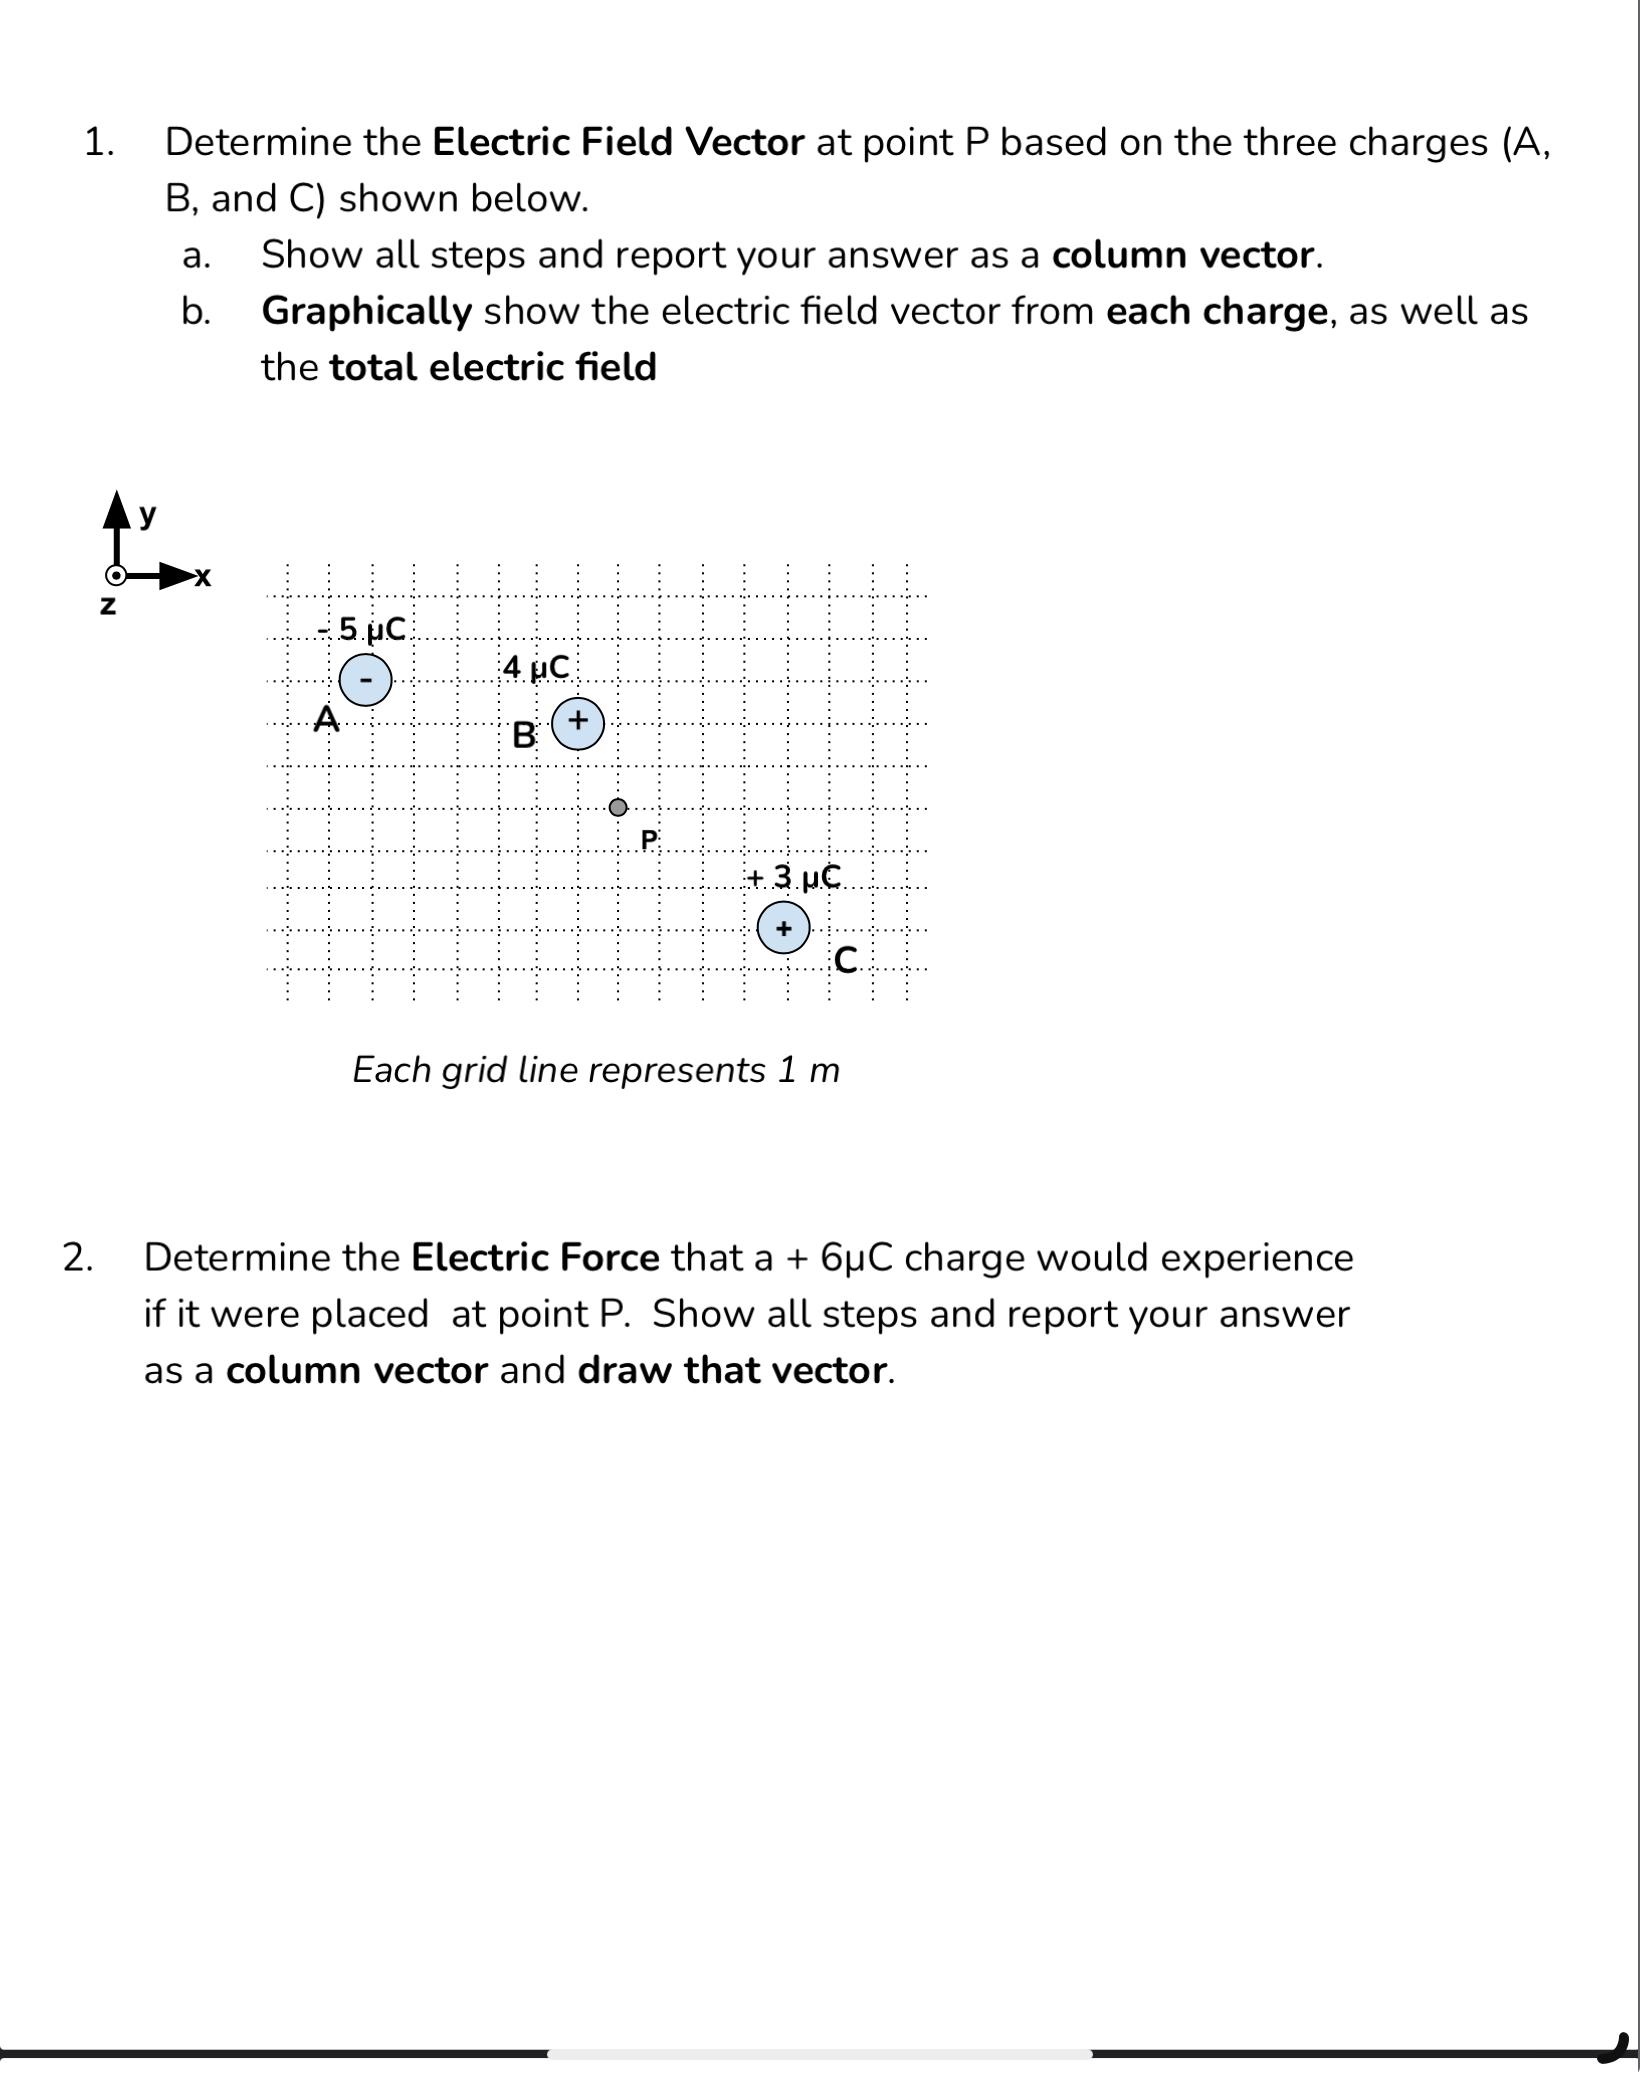
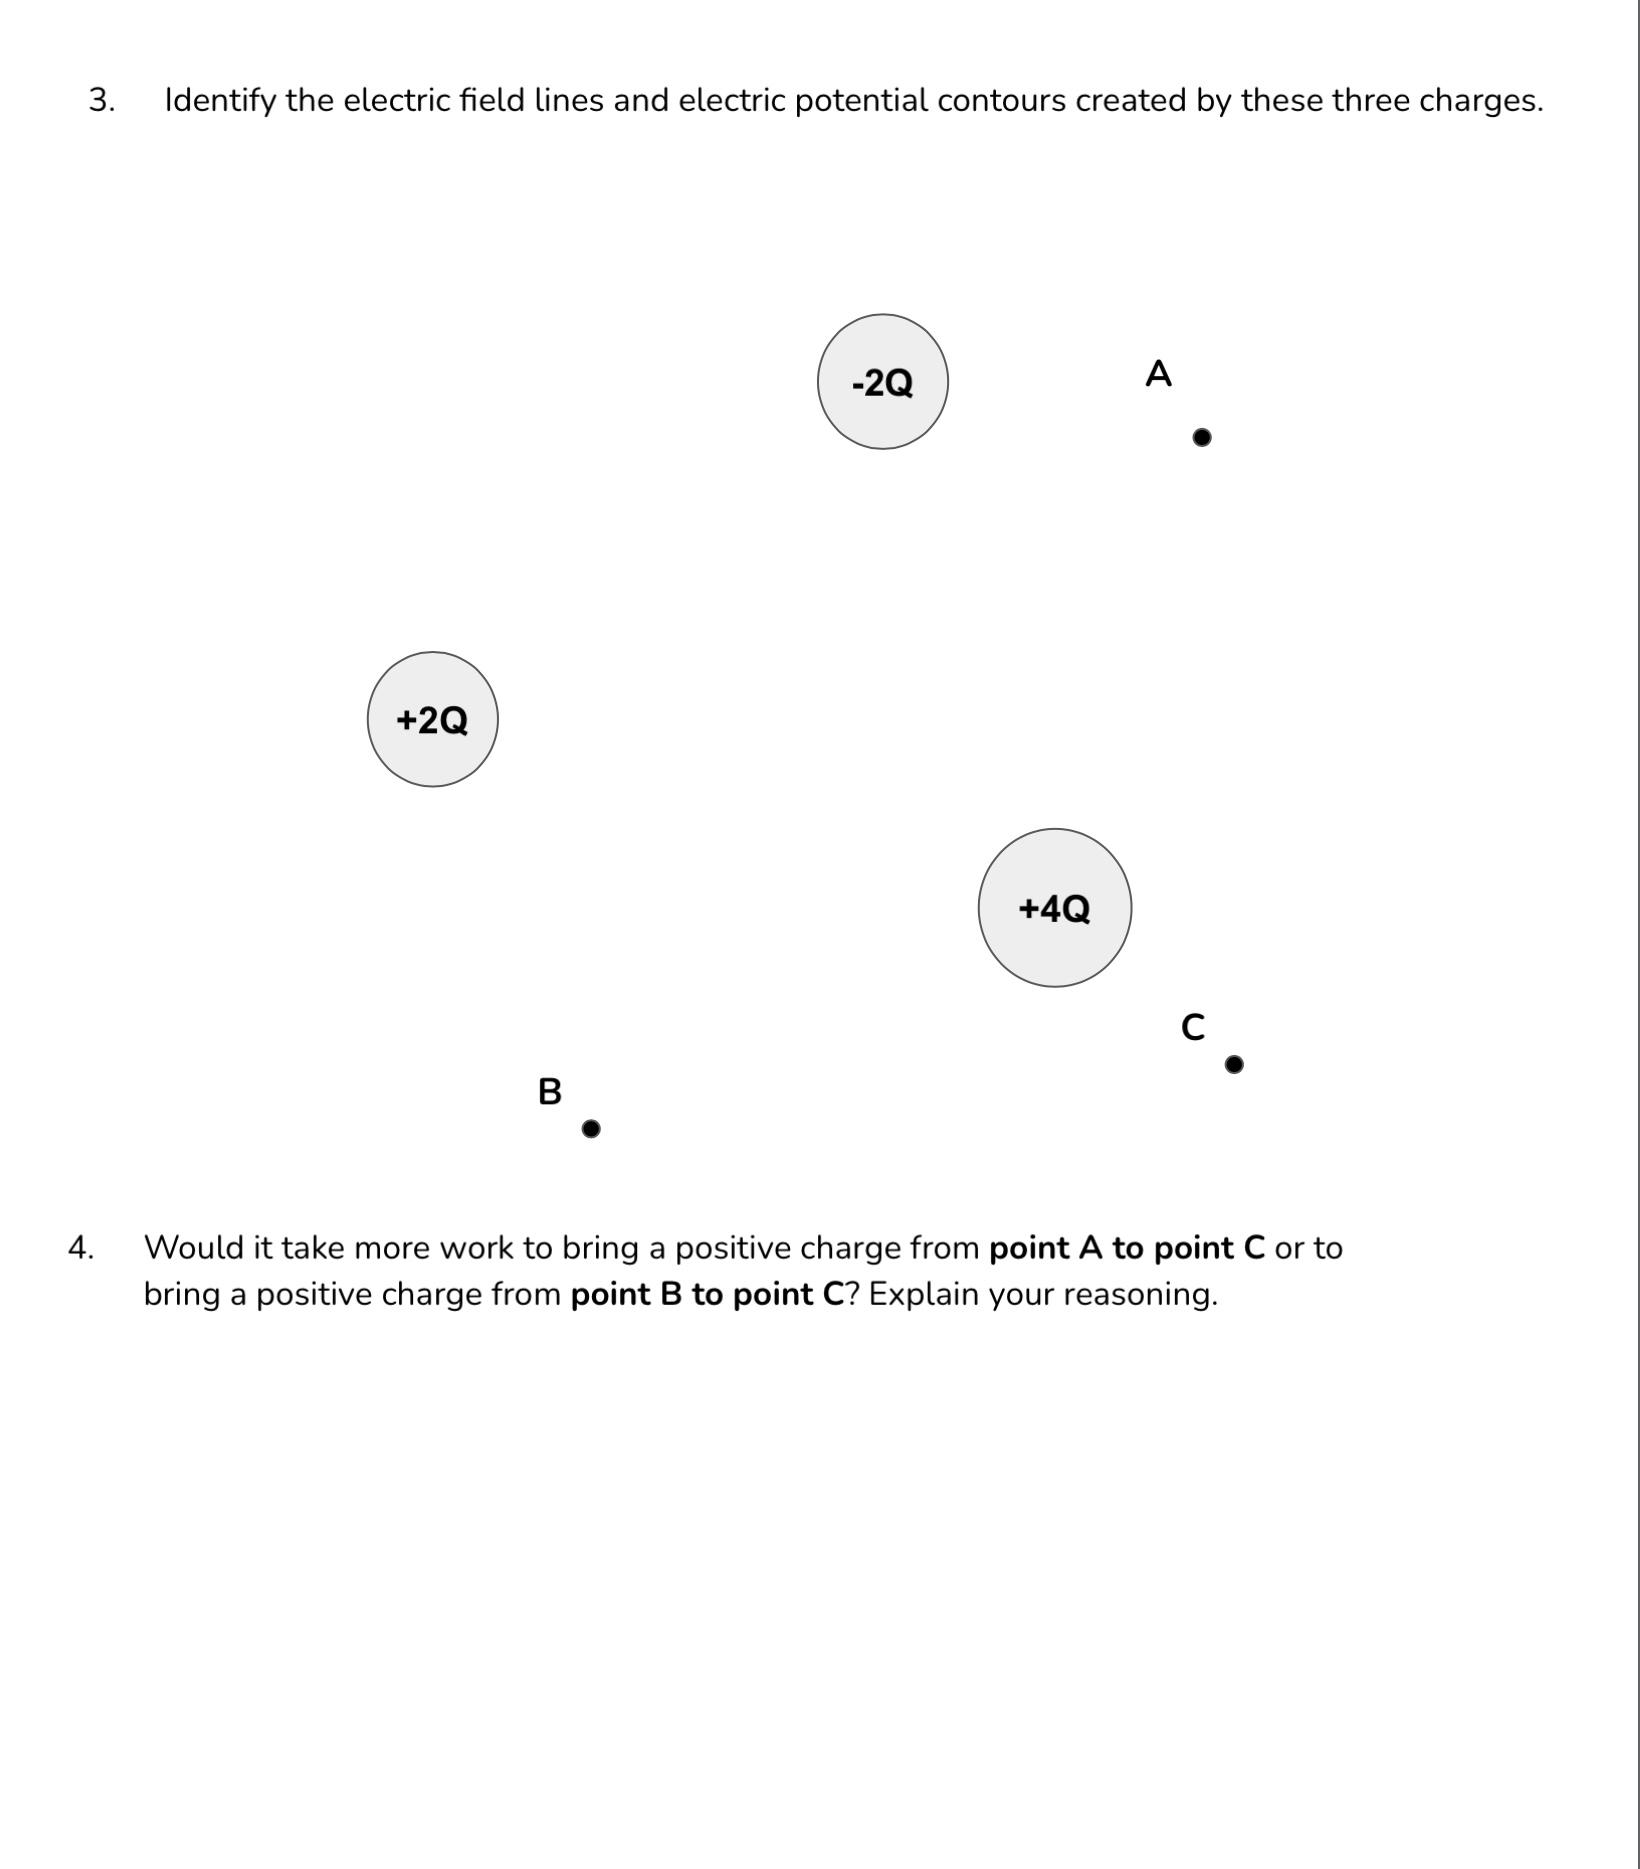
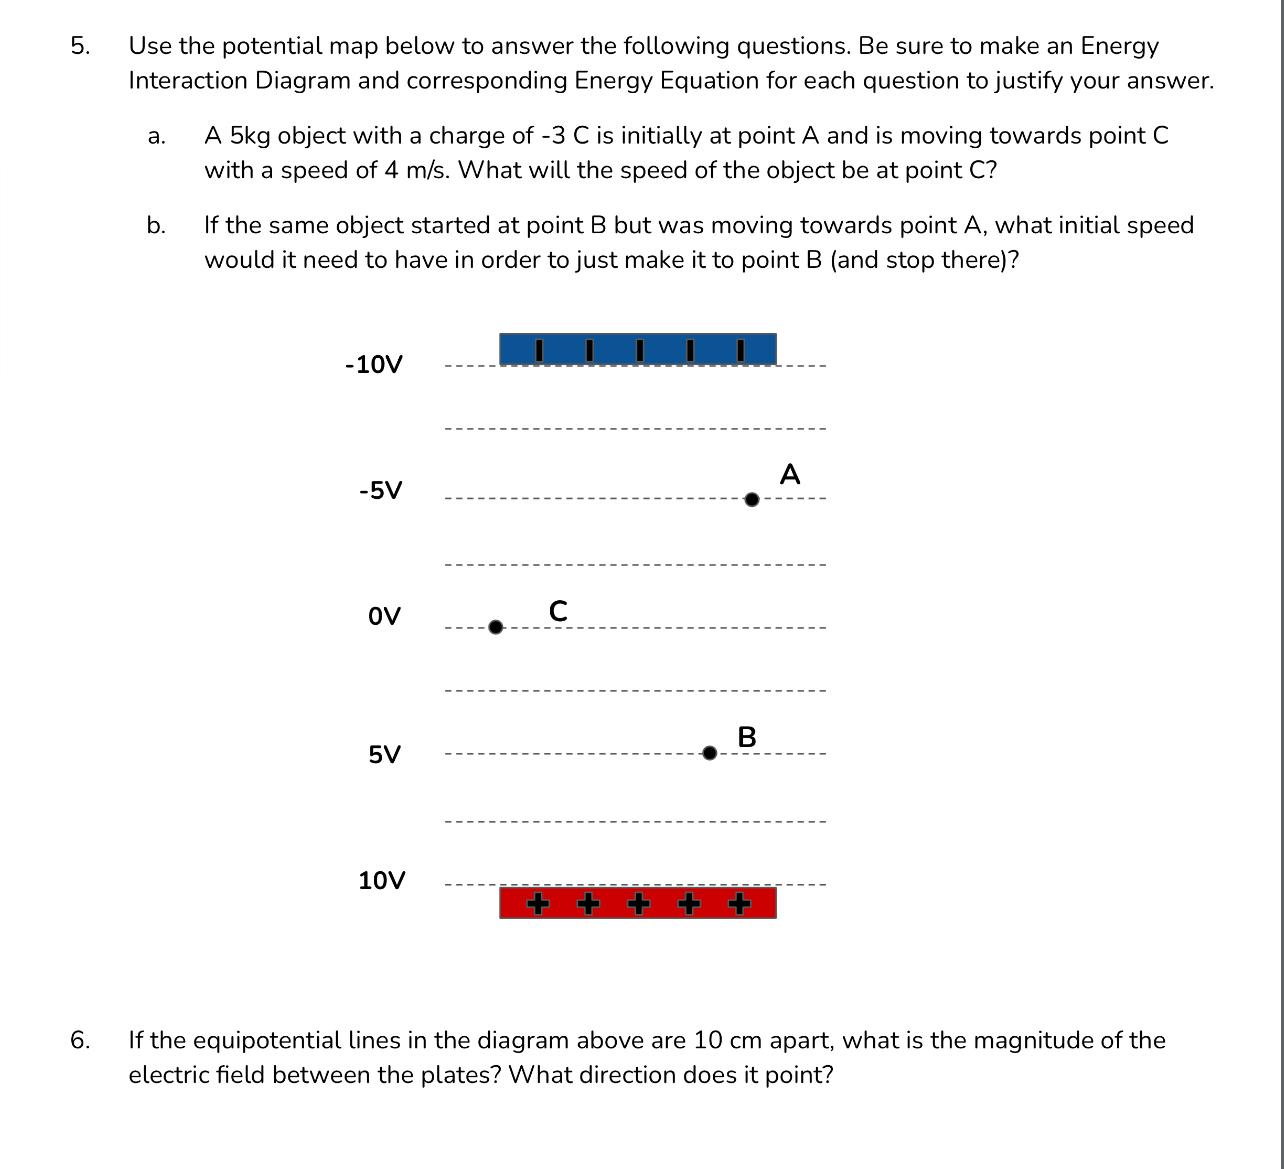
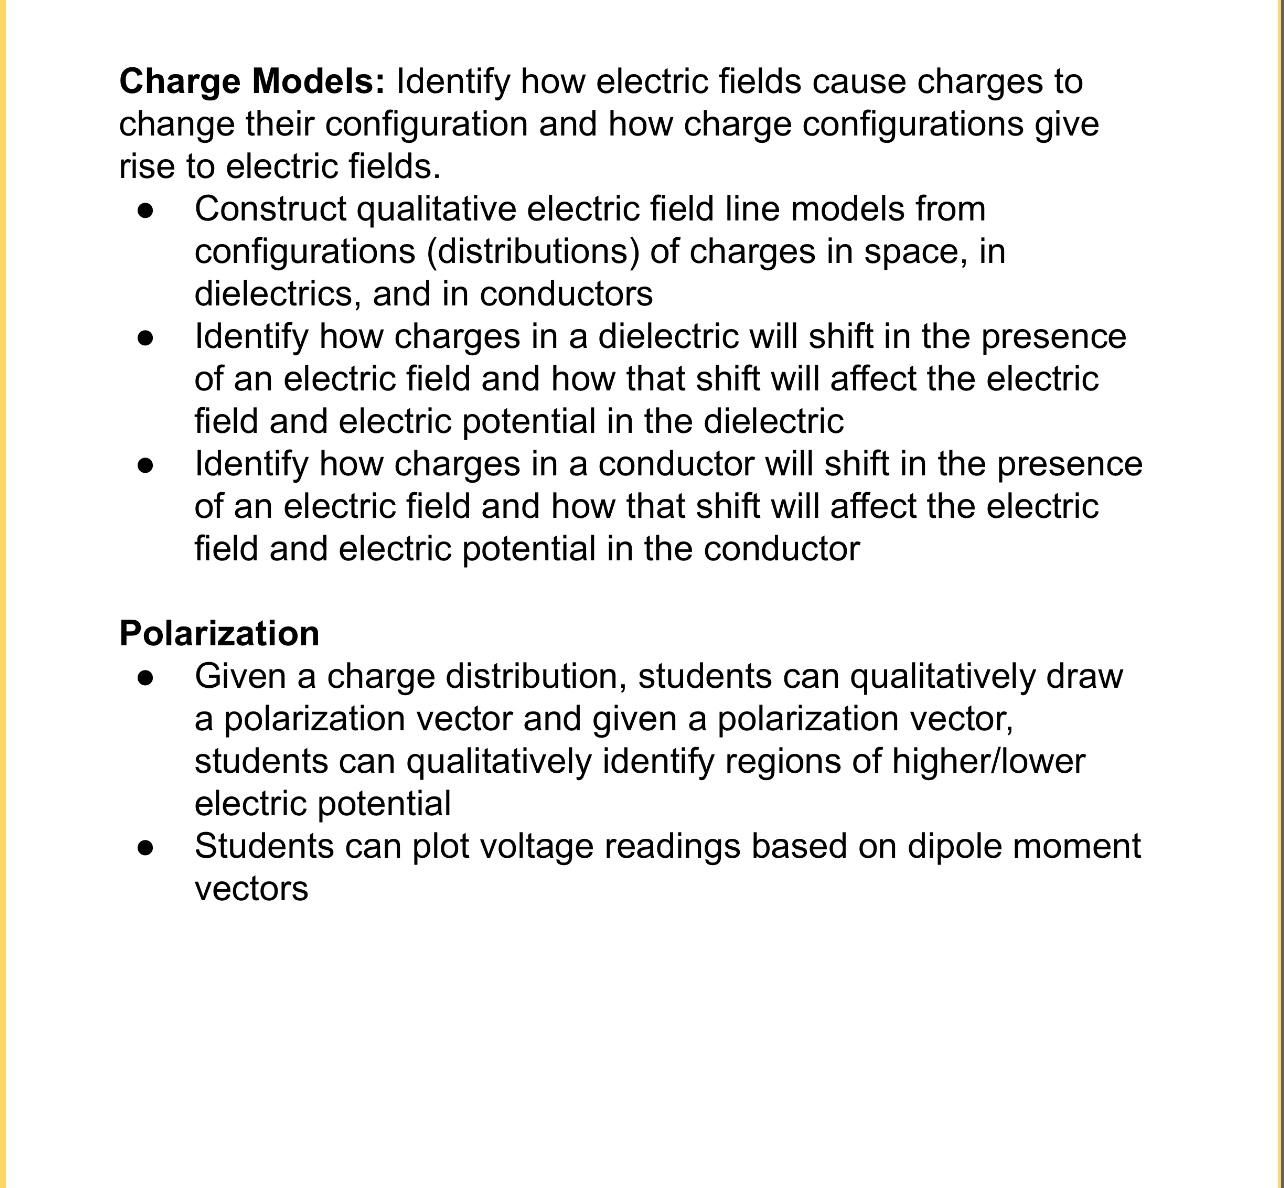
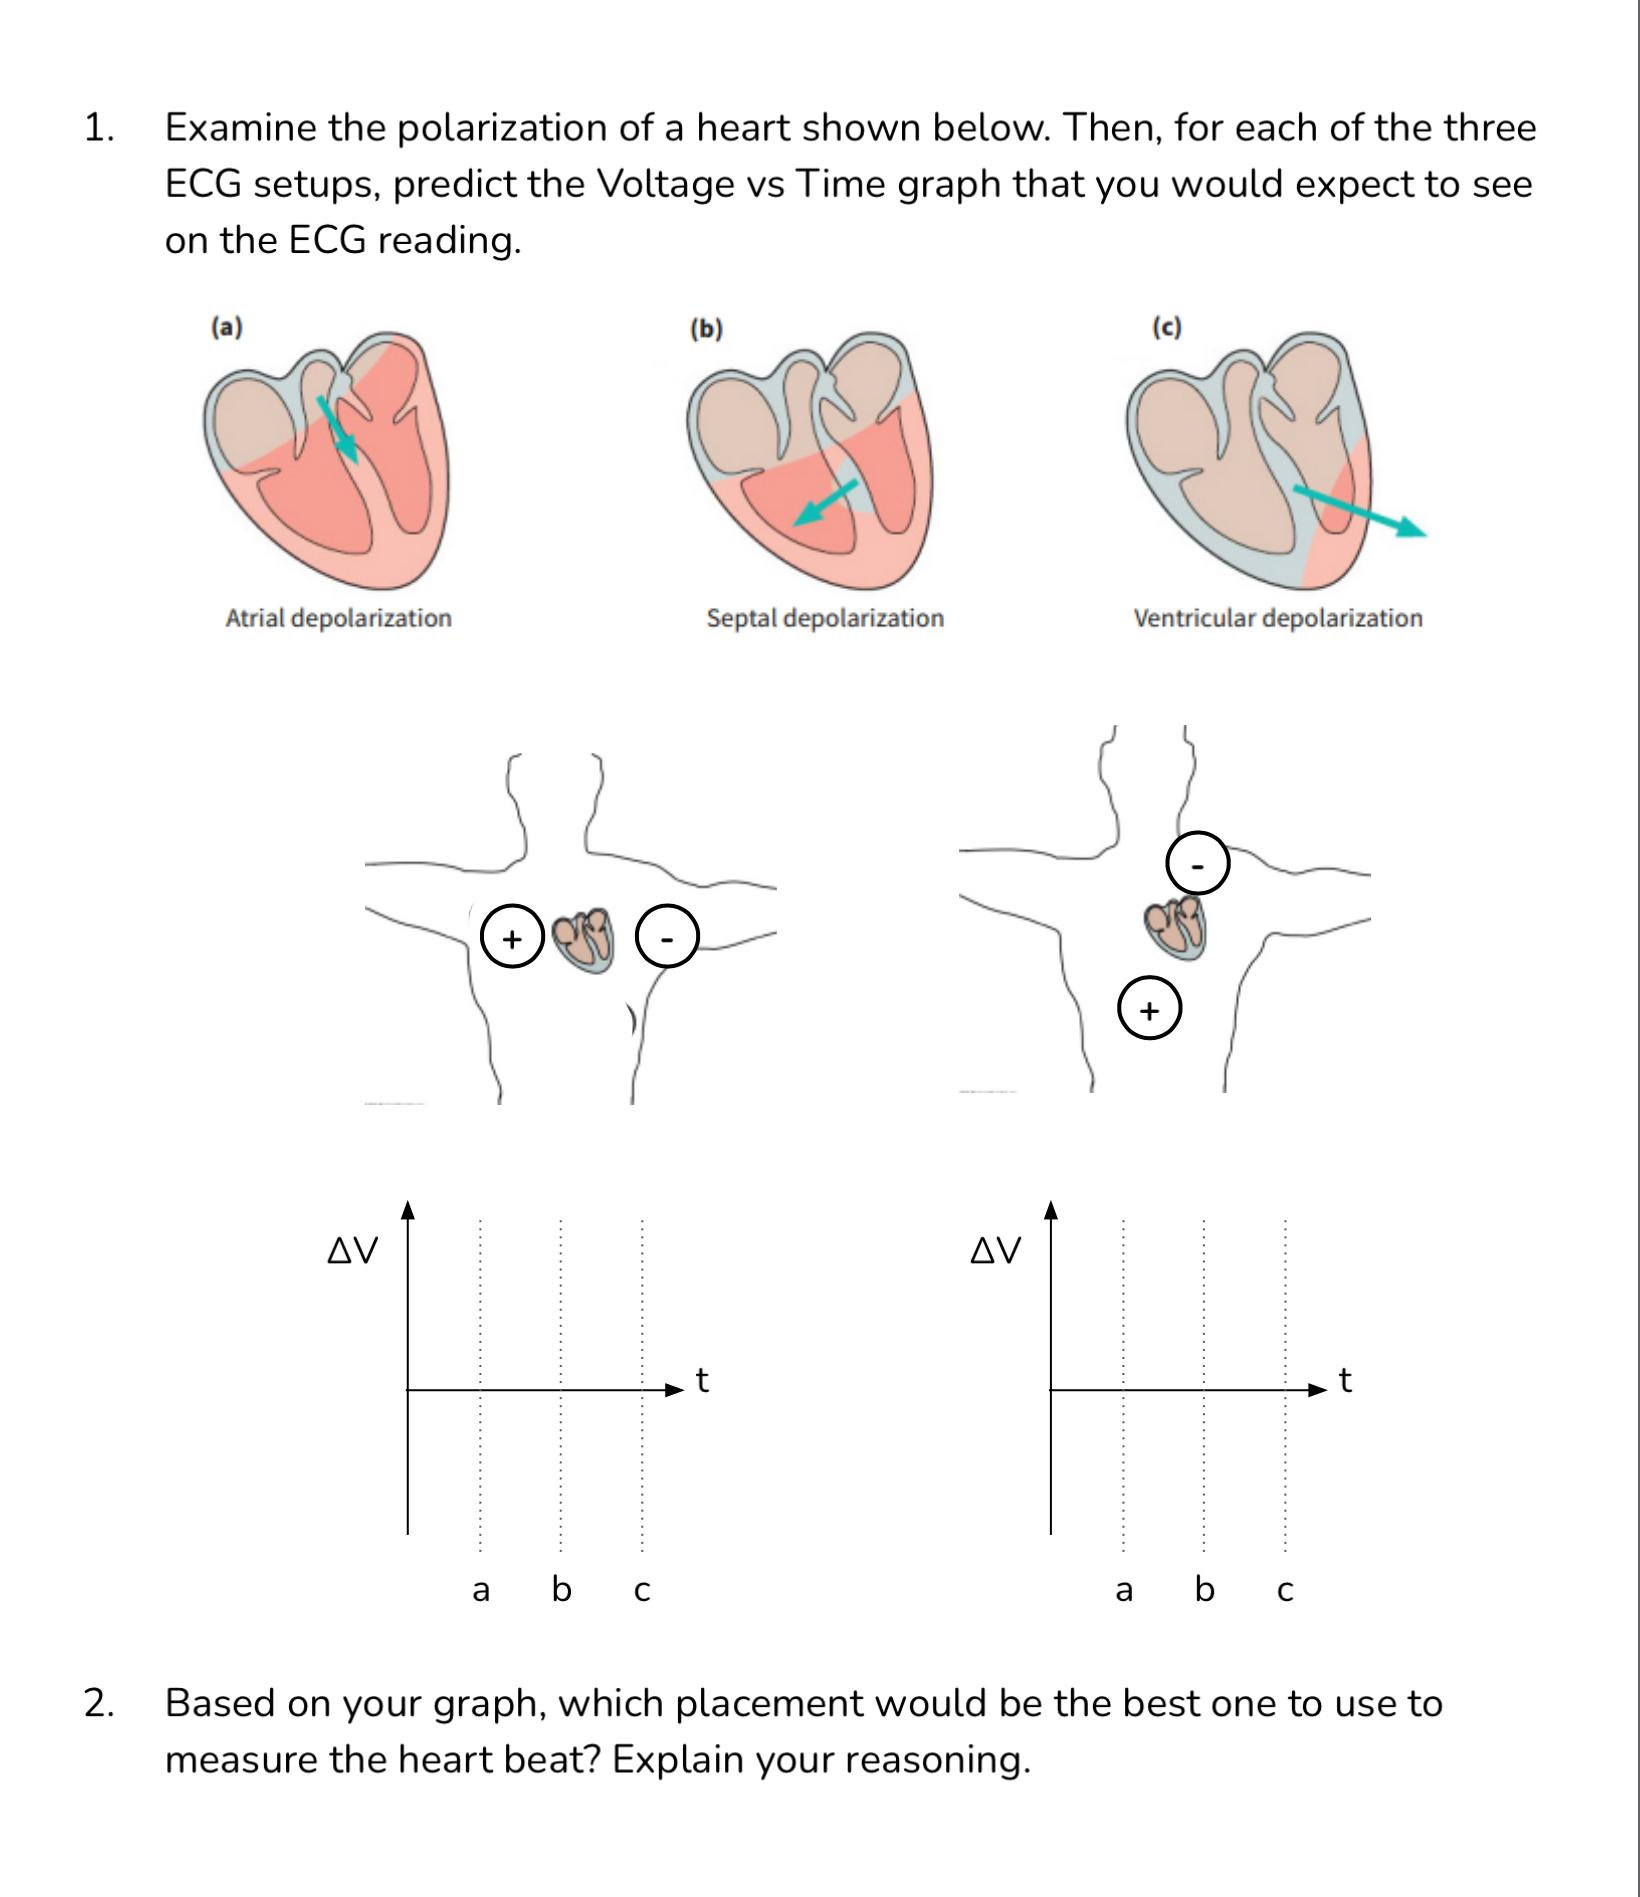
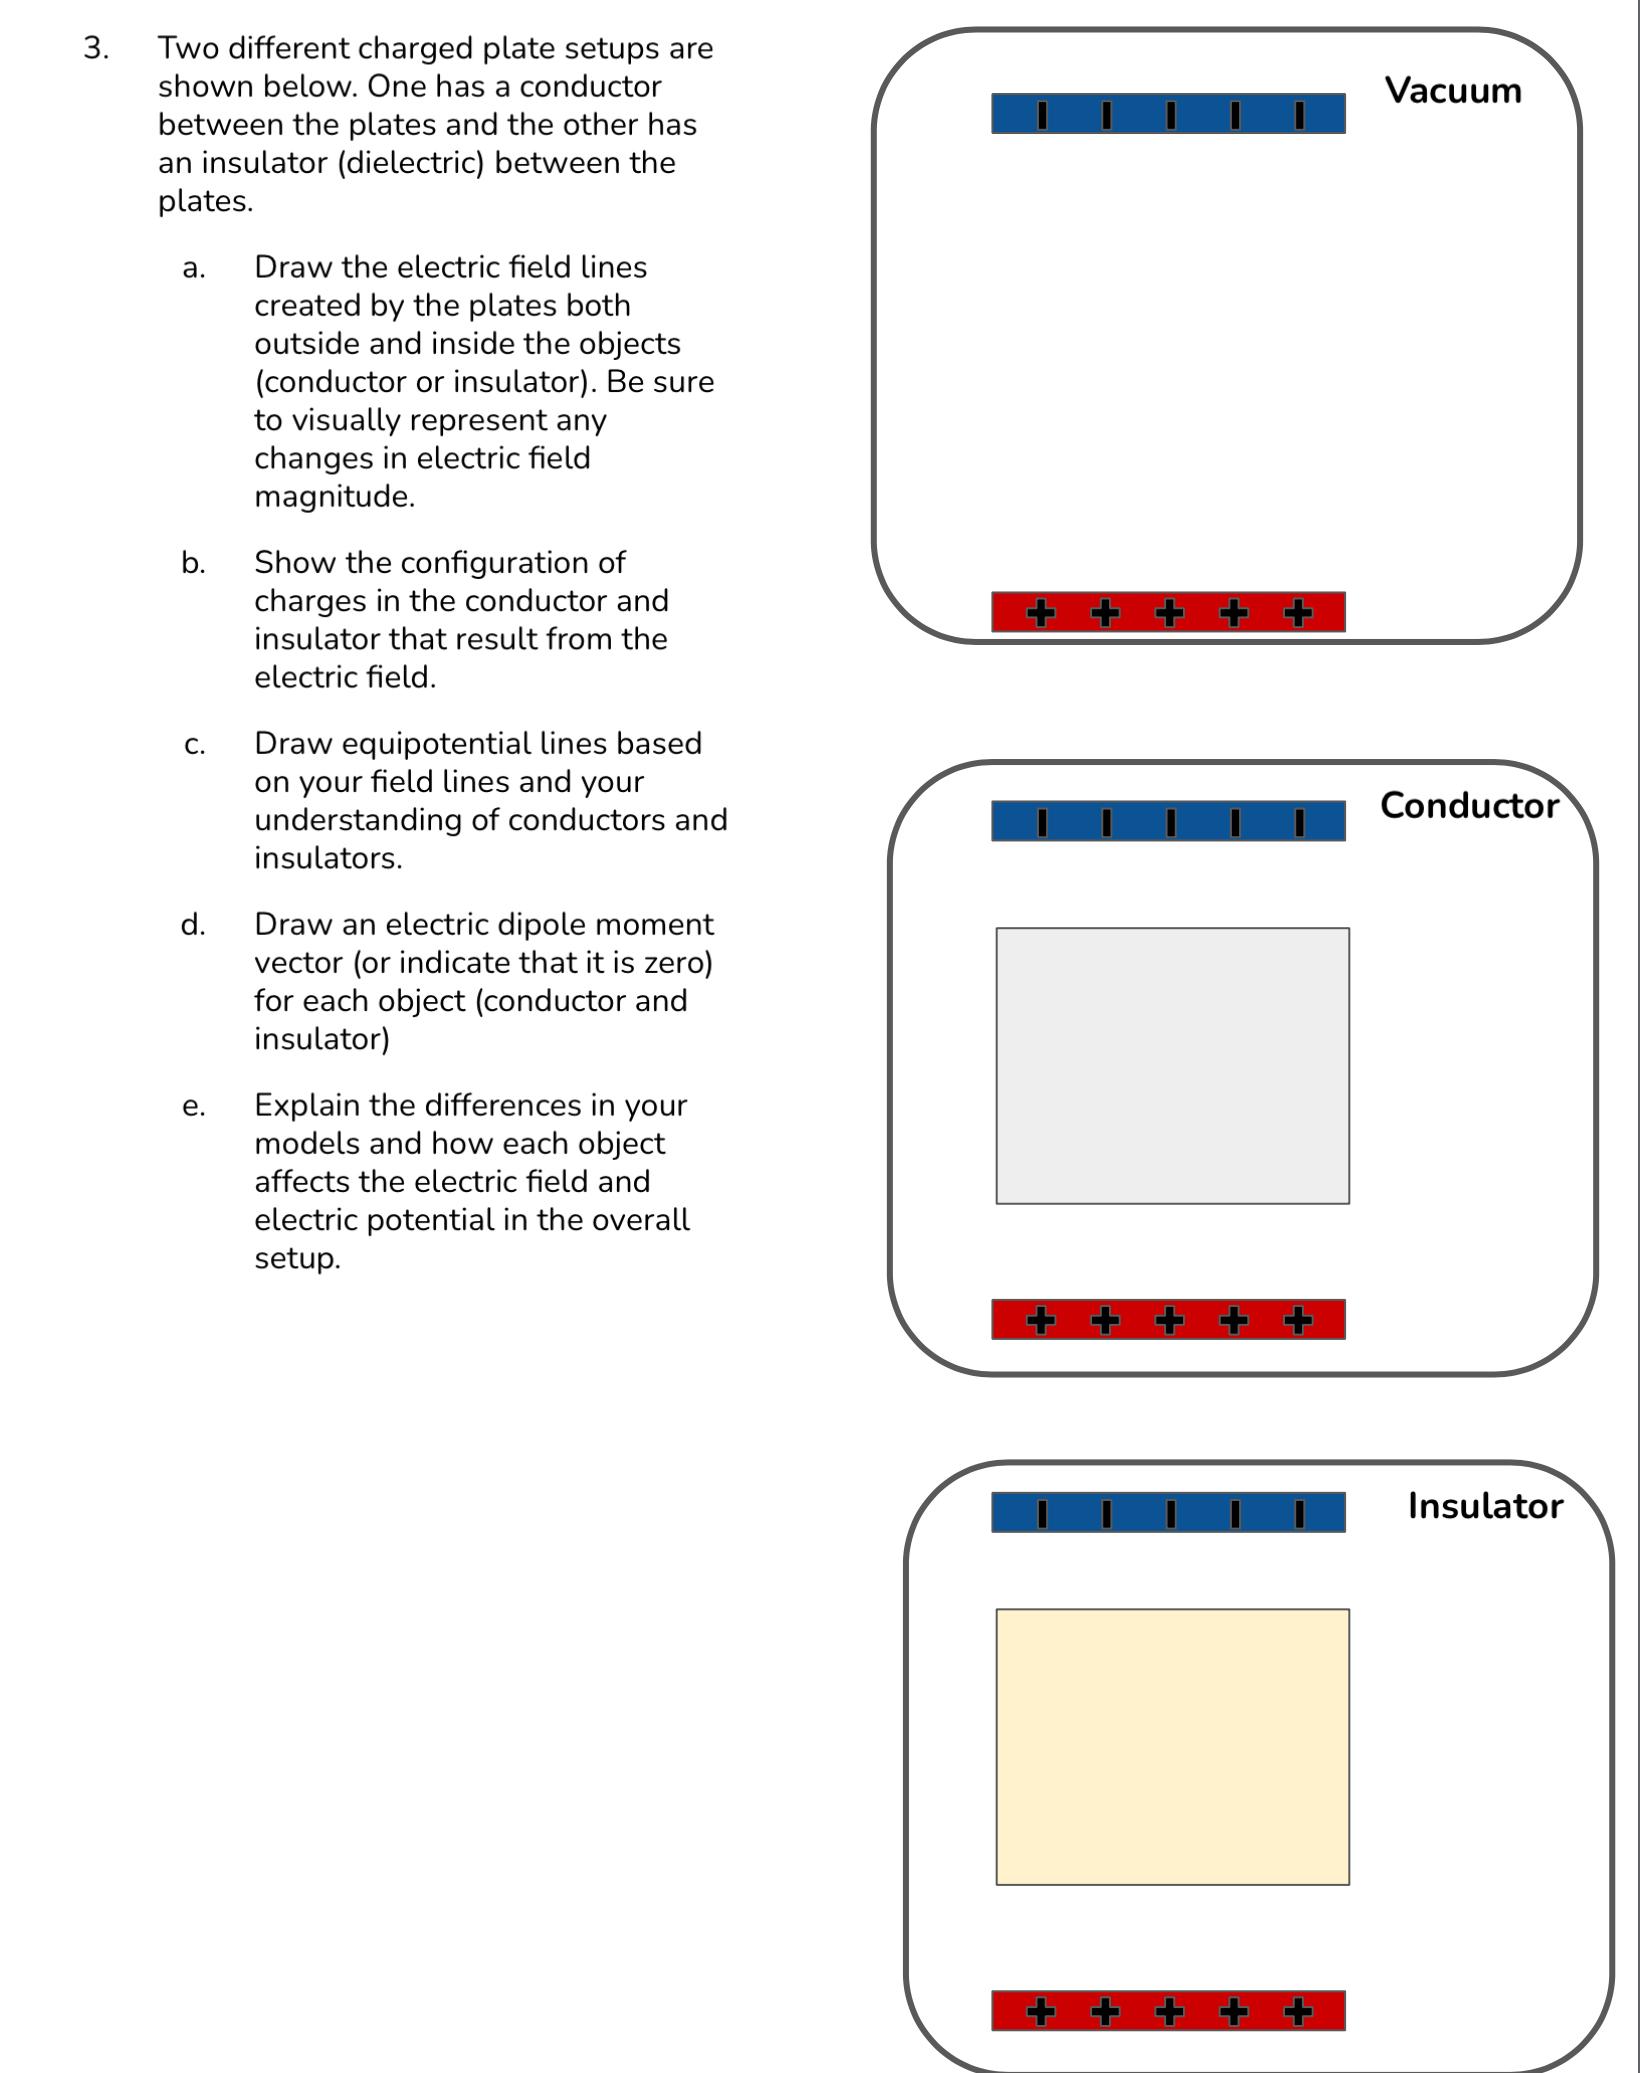
Model the electric fields created by charge distributions and the effect that electric fields have on charged particles Use vector representations (graphical, column vector) to identify the electric field at a point that is created by a charge. Use the principle of superposition and vector representations (graphical, column vector) to identify the electric field at a point that is created by multiple charges. Identify how charged particles will respond to electric fields (ie, direction of force/acceleration) in: a vacuum, a dielectric, a conductor. Use vector representations (graphical, column vector) to model the electric force from Coulomb's law and from E = F/ q Electric Potential: Use electric potential models ("contour map") to describe the electric potential created by a charge distribution and determine changes in energy for charges that change their position. Create electric potential diagrams field lines from a distribution of point charges Use an energy interaction diagram to determine changes in energy for open/closed systems. 1. Determine the Electric Field Vector at point P based on the three charges (A, B, and C) shown below. a. Show all steps and report your answer as a column vector. Graphically show the electric field vector from each charge, as well as the total electric field 1 Z 2. 5.C 4 C B + +3..C. t... II Each grid line represents 1 m C. Determine the Electric Force that a + 6C charge would experience if it were placed at point P. Show all steps and report your answer as a column vector and draw that vector. 3. 4. Identify the electric field lines and electric potential contours created by these three charges. +2Q B -2Q +4Q A Would it take more work to bring a positive charge from point A to point C or to bring a positive charge from point B to point C? Explain your reasoning. 5. 6. Use the potential map below to answer the following questions. Be sure to make an Energy Interaction Diagram and corresponding Energy Equation for each question to justify your answer. a. A 5kg object with a charge of -3 C is initially at point A and is moving towards point C with a speed of 4 m/s. What will the speed of the object be at point C? b. If the same object started at point B but was moving towards point A, what initial speed would it need to have in order to just make it to point B (and stop there)? -10V -5V OV 5V 10V C + + + B A If the equipotential lines in the diagram above are 10 cm apart, what is the magnitude of the electric field between the plates? What direction does it point? Charge Models: Identify how electric fields cause charges to change their configuration and how charge configurations give rise to electric fields. Construct qualitative electric field line models from configurations (distributions) of charges in space, in dielectrics, and in conductors Identify how charges in a dielectric will shift in the presence of an electric field and how that shift will affect the electric field and electric potential in the dielectric Identify how charges in a conductor will shift in the presence of an electric field and how that shift will affect the electric field and electric potential in the conductor Polarization Given a charge distribution, students can qualitatively draw a polarization vector and given a polarization vector, students can qualitatively identify regions of higher/lower electric potential Students can plot voltage readings based on dipole moment vectors 1. Examine the polarization of a heart shown below. Then, for each of the three ECG setups, predict the Voltage vs Time graph that you would expect to see on the ECG reading. Atrial depolarization V + abc (b) Septal depolarization AV (c) Ventricular depolarization + a b c t 2. Based on your graph, which placement would be the best one to use to measure the heart beat? Explain your reasoning. 3. Two different charged plate setups are shown below. One has a conductor between the plates and the other has an insulator (dielectric) between the plates. a. b. C. d. e. Draw the electric field lines created by the plates both outside and inside the objects (conductor or insulator). Be sure to visually represent any changes in electric field magnitude. Show the configuration of charges in the conductor and insulator that result from the electric field. Draw equipotential lines based on your field lines and your understanding of conductors and insulators. Draw an electric dipole moment vector (or indicate that it is zero) for each object (conductor and insulator) Explain the differences in your models and how each object affects the electric field and electric potential in the overall setup. + + + + + + + + + Vacuum Conductor Insulator
Step by Step Solution
3.32 Rating (170 Votes )
There are 3 Steps involved in it
To determine the electric field vector at point P due to the three charges A B and C shown below we ... View full answer

Get step-by-step solutions from verified subject matter experts