

Question: Modeling Output Dependent Variable: Durability of Pipe in Years, ( DURBLTY ) table [ [ table [ [ Symbol ] , [ (
Modeling Output
Dependent Variable: Durability of Pipe in Years, DURBLTY
tabletableSymbolIndependentVariablestableCoefficientEstimatetstatistic,tabless the VariablesignificantYesNotableIntuitiveness ofthe resulttableReasons for Intuitiveness or NonIntuitivenessConstant Term,,,,,tableMATRL if concrete if steeltableACIDTY if not acidia if acidictableAVFLOWs gallonsper hrGRADE tableMNTCE$s perlinear mile
e Using stepwise regression analysis methods, determine the "best" predictive regression function to model the durability of pipe. Choose the "best" model based on adjusted Rsquare value and such that each explanatory variable has a statistical significance value of or better and the overall model utility value of or better. You may choose to use either Excel functions or SPSS statistical software available in vlabs on the UML website to perform the stepwise analysis. Show all results.
f Answer the same questions from part d with the "improved" predictive linear regression model. Comment on your results.
g Using the Interquartile IQR Method and Chauvenet's Criterion, determine if any of the AVFLOW data should be considered as outliers. Data for Problem :
tablePIPE IDAVFLOW,MNTCES,GRADE,MATRL,ACIDITY,DURBLTYP P P P P P P P P P P P P P P P P P P P P P P P P P P P P P Problem : Multiple Regression Model Development
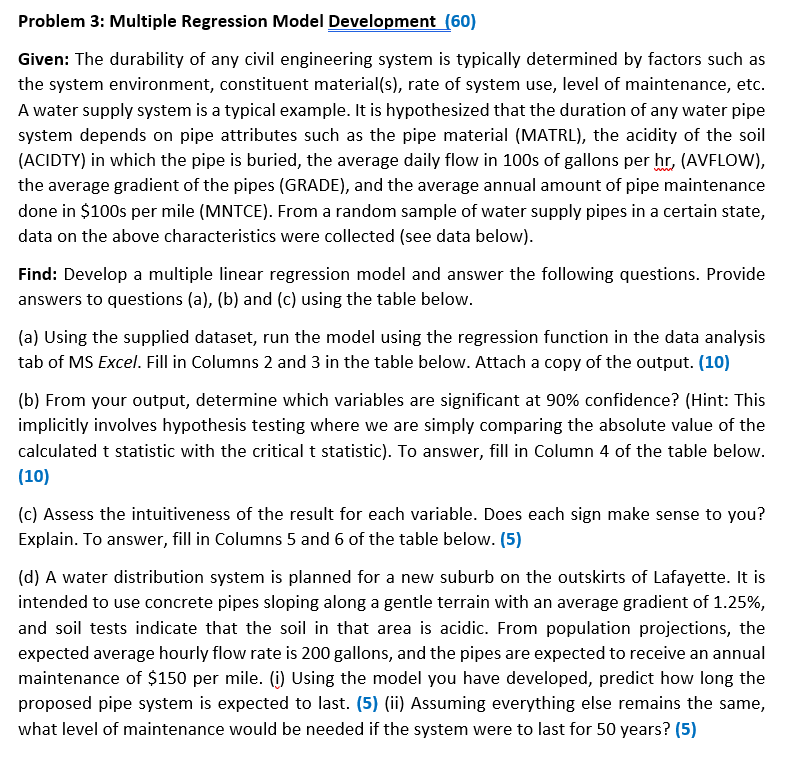
Given: The durability of any civil engineering system is typically determined by factors such as
the system environment, constituent materials rate of system use, level of maintenance, etc.
A water supply system is a typical example. It is hypothesized that the duration of any water pipe
system depends on pipe attributes such as the pipe material MATRL the acidity of the soil
ACIDTY in which the pipe is buried, the average daily flow in s of gallons per AVFLOW
the average gradient of the pipes GRADE and the average annual amount of pipe maintenance
done in $s per mile MNTCE From a random sample of water supply pipes in a certain state,
data on the above characteristics were collected see data below
Find: Develop a multiple linear regression model and answer the following questions. Provide
answers to questions ab and c using the table below.
a Using the supplied dataset, run the model using the regression function in the data analysis
tab of MS Excel. Fill in Columns and in the table below. Attach a copy of the output.
b From your output, determine which variables are significant at confidence? Hint: This
implicitly involves hypothesis testing where we are simply comparing the absolute value of the
calculated statistic with the critical statistic To answer, fill in Column of the table below.
c Assess the intuitiveness of the result for each variable. Does each sign make sense to you?
Explain. To answer, fill in Columns and of the table below.
d A water distribution system is planned for a new suburb on the outskirts of Lafayette. It is
intended to use concrete pipes sloping along a gentle terrain with an average gradient of
and soil tests indicate that the soil in that area is acidic. From population projections, the
expected average hourly flow rate is gallons, and the pipes are expected to receive an annual
maintenance of $ per mile. i Using the model you have developed, predict how long the
proposed pipe system is expected to last. ii Assuming everything else remains the same,
what level of maintenance would be needed if the system were to last for years?
Step by Step Solution
There are 3 Steps involved in it
1 Expert Approved Answer
Step: 1 Unlock

Question Has Been Solved by an Expert!
Get step-by-step solutions from verified subject matter experts
Step: 2 Unlock
Step: 3 Unlock