

Question: Modeling. Presenting, and Discussing Data https://App.admentum.com/content delivers/gracicris Modeling, Presenting, and Discussing Data in this activity, you will collect and model your own set of bivariate
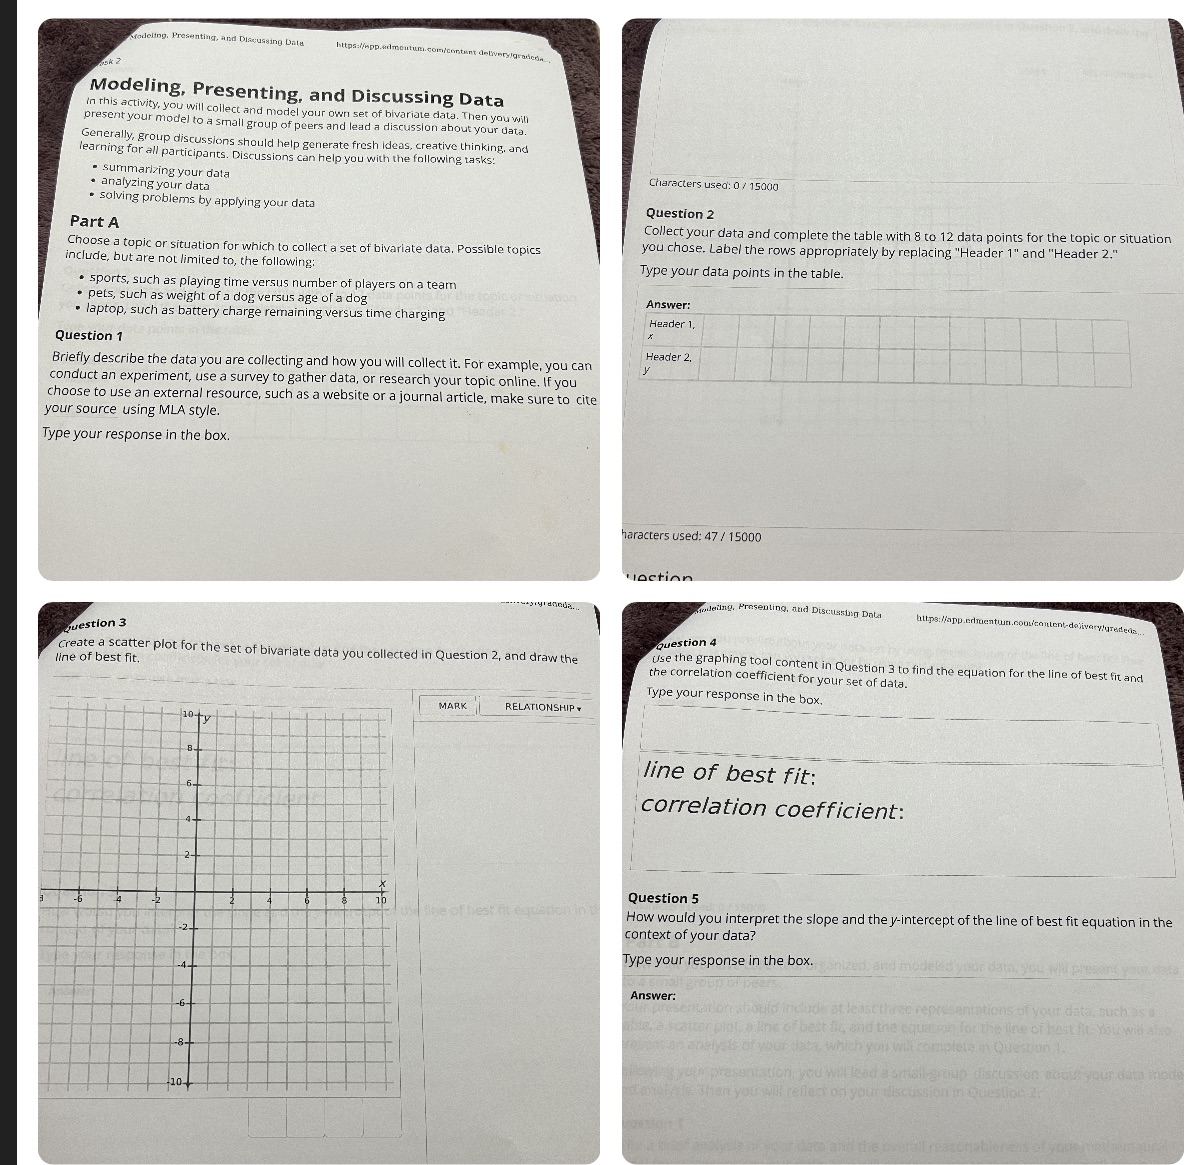
Modeling. Presenting, and Discussing Data https://App.admentum.com/content delivers/gracicris Modeling, Presenting, and Discussing Data in this activity, you will collect and model your own set of bivariate data. Then you will present your model to a small group of peers and lead a discussion about your data. Generally, group discussions should help generate fresh ideas, creative thinking, and learning for all participants. Discussions can help you with the following tasks: - summarizing your data Characters used: 0/ 15000 . analyzing your data . solving problems by applying your data Question 2 Part A Collect your data and complete the table with 8 to 12 data points for the topic or situation Choose a topic or situation for which to collect a set of bivariate data. Possible topics you chose. Label the rows appropriately by replacing "Header 1" and "Header 2." include, but are not limited to, the following: Type your data points in the table. . sports, such as playing time versus number of players on a team pets, such as weight of a dog versus age of a dog Answer: . laptop, such as battery charge remaining versus time charging Header 1. Question 1 Header 2. Briefly describe the data you are collecting and how you will collect it. For example, you can conduct an experiment, use a survey to gather data, or research your topic online. If you choose to use an external resource, such as a website or a journal article, make sure to cite your source using MLA style. Type your response in the box. laracters used: 47 / 15000 action Moderng. Presenting, and Discussing Data https:/app.crimentum.com/content-delivery/urededs,. Question 3 Question 4 create a scatter plot for the set of bivariate data you collected in Question 2, and draw the line of best fit. use the graphing tool content in Question 3 to find the equation for the line of best fit and the correlation coefficient for your set of data. Type your response in the box MARK RELATIONSHIP line of best fit: correlation coefficient: Question 5 How would you interpret the slope and the y-intercept of the line of best fit equation in the context of your data? Type your response in the box. Answer: station should inc scatter plot, a line of best the wwfor the line of best fit. You with a
Step by Step Solution
There are 3 Steps involved in it

Get step-by-step solutions from verified subject matter experts