

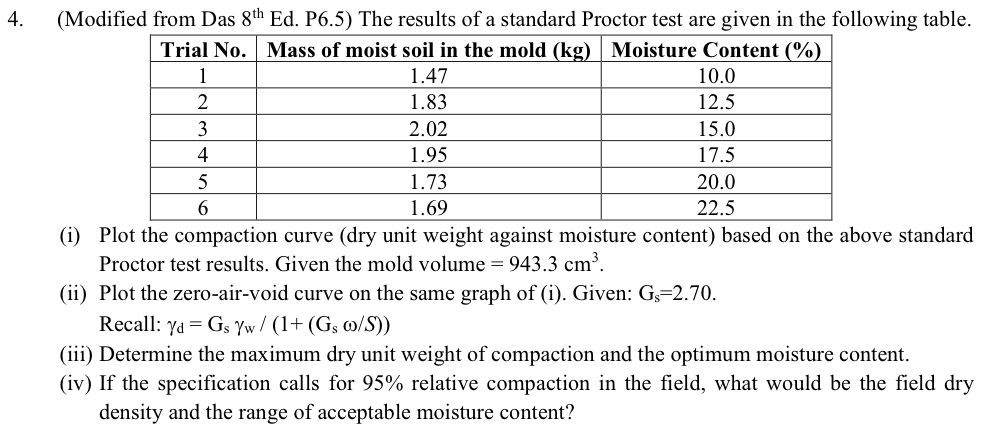
Question: ( Modified from Das 8 t h Ed . P 6 . 5 ) The results of a standard Proctor test are given in the
Modified from Das Ed P The results of a standard Proctor test are given in the following table.
i Plot the compaction curve dry unit weight against moisture content based on the above standard
Proctor test results. Given the mold volume
ii Plot the zeroairvoid curve on the same graph of i Given:
Recall:
iii Determine the maximum dry unit weight of compaction and the optimum moisture content.
iv If the specification calls for relative compaction in the field, what would be the field dry
density and the range of acceptable moisture content?
Step by Step Solution
There are 3 Steps involved in it
1 Expert Approved Answer
Step: 1 Unlock

Question Has Been Solved by an Expert!
Get step-by-step solutions from verified subject matter experts
Step: 2 Unlock
Step: 3 Unlock