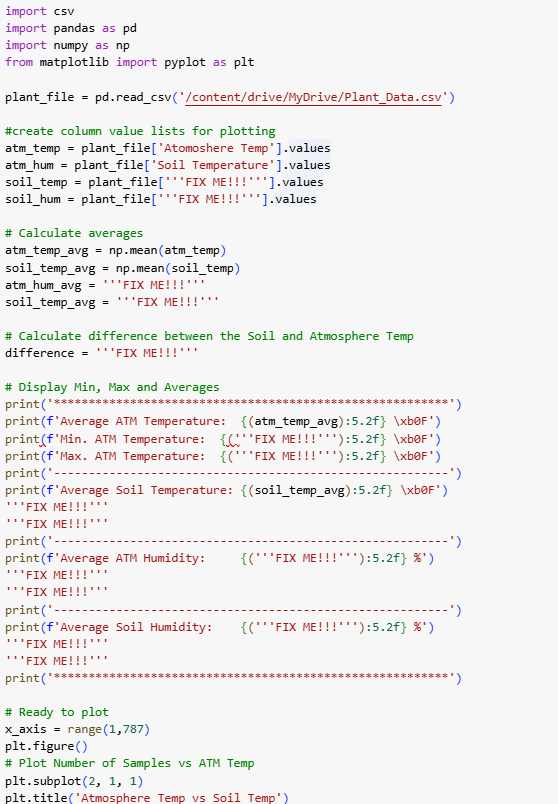
Question: Modify the code below to: 1. Read Soil Humidity, Soil Temperature, Atomosphere Humidity and Atomosphere Temp values from the Plant_Data.csv file. 2. Calculate and displayModify the code below to:
1. Read Soil Humidity, Soil Temperature, Atomosphere Humidity and Atomosphere Temp values from the Plant_Data.csv file.
2. Calculate and display the minimum, maximum and average values for Soil and Atomosphere Temp as degrees Farenheit and the Soil and Atomosphere Humidity as a percentage.
3. Plot Soil Temperature and Soil Humidity against total number of samples. Both plots must be shown in a single figure. Use subplot.
4. Plot Atmosphere Temperature and Atmosphere Humidity against total number of samples. Both plots must be shown in a single figure. Use subplot.
5. Plot the difference between the Soil and Atmosphere Temp against total number of samples.
6. Save all plots with proper title as .pdf.
import csv import pandas as pd import numpy as np from matplotlib import pyplot as plt plant_file = pd. read_csv('/content/drive/MyDrive/Plant_Data. cav' ) #create column value lists for plotting atm_temp = plant_file[ 'Atomoshere Temp' ]. values atm_hum = plant_file[ 'Soil Temperature' ]. values soil_temp = plant_file[ ' "'FIX ME! ! !' "']. values soil_hum = plant_file[ " ''FIX ME! ! !" " "]. values # Calculate averages atm_temp_avg = np. mean(atm_temp ) soil_temp_avg = np. mean(soil_temp) atm_hum avg = ""'FIX ME! ! ! " ! ' soil_temp_avg = ""'FIX ME! ! ! " "' # Calculate difference between the Soil and Atmosphere Temp difference = ""'FIX ME! ! ! " " " # Display Min, Max and Averages print (f' Average ATM Temperature: {(atm_temp_avg) :5.2f} \\xbOF' ) print(f'Min. ATM Temperature: {("'FIX ME! ! ! ' " ') : 5.2f} \\xbOF' ) print (f'Max. ATM Temperature: { ('"'FIX ME! ! !' ' ') :5.2f} \\xbOF' ) print ( ' - - - print (f* Average Soil Temperature: { (soil_temp_avg) :5.2f} \\xbOF' ) " "FIX ME! ! ! " " . ""FIX ME! ! ! " " print ( ' -- print (f ' Average ATM Humidity: {(' ''FIX ME! ! ! ' ' ') :5.2f} %' ) " "FIX ME! ! ! " " . ""FIX ME! ! ! " . . print ( ' -- print (f' Average Soil Humidity: {('"FIX ME! ! !' ' ') :5.2f} *' ) ""FIX ME! ! ! " '. " "'FIX ME! ! ! " . . # Ready to plot x_axis = range(1, 787) pit. figure() # Plot Number of Samples vs ATM Temp pit. subplot(2, 1, 1) plt. title( 'Atmosphere Temp vs Soil Temp" )pit . xlabel( 'Time' ) plt. ylabel( ' Temperature' ) plt. legend( " "'FIX ME! ! !" " ") plt. plot(x_axis, atm_temp, 'r' ) # Plot Number of Samples vs ATM Humidity plt . subplot( " " 'FIX ME! ! !" " ") plt. title(" "'FIX ME! ! !" "') plt. xlabel( ' "'FIX ME! ! !" " " ) plt. ylabel( " "'FIX ME! ! !" " ' pit. legend( ' "'FIX ME! ! ! " " ") pit. plot(" "'FIX ME! ! ! " " ") # Show the plots on one subplot plt. tight_layout( ) # save plot plt . savefig( 'ATM_Temp_Hum. pdf' ) plt. figure() # Plot Number of Samples vs Soil Temp plt. subplot( " " 'FIX ME! ! !" " ") plt. title( " "'FIX ME! ! !" "') plt. xlabel( ' "'FIX ME! ! !" " ' pit. ylabel( " "'FIX ME! ! ! " " pit. legend( " "'FIX ME! ! ! " " " ) plt. plot( " "'FIX ME! ! ! " " " ) # Plot Number of Samples vs Soil Humidity plt . subplot( " " 'FIX ME! ! ! " " ') pit. title(" "'FIX ME! ! !" "") pit. xlabel( ' "'FIX ME! ! ! " "" ) plt. ylabel( " "'FIX ME! ! !" "') plt. legend( " "'FIX ME! ! ! " " ") plt. plot( " "'FIX ME! ! !" " ") # Show the plots on one subplot pit. tight_layout( ) # save plot plt. savefig( " "'FIX ME! ! ! " " ") # Plot Number of Samples vs difference between the Soil and Atmosphere Temp pit . figure() plt. title( " "'FIX ME! ! ! " " ") plt. xlabel( ' "'FIX ME! ! ! " "' ) pit. ylabel( " "'FIX ME! ! ! " " ' ) plt. legend( " "'FIX ME! ! ! " " " pit. plot( ' "'FIX ME! ! !" "") # save plot plt. savefig( " "'FIX ME! ! ! " " ") # Display figures pit . show ( )