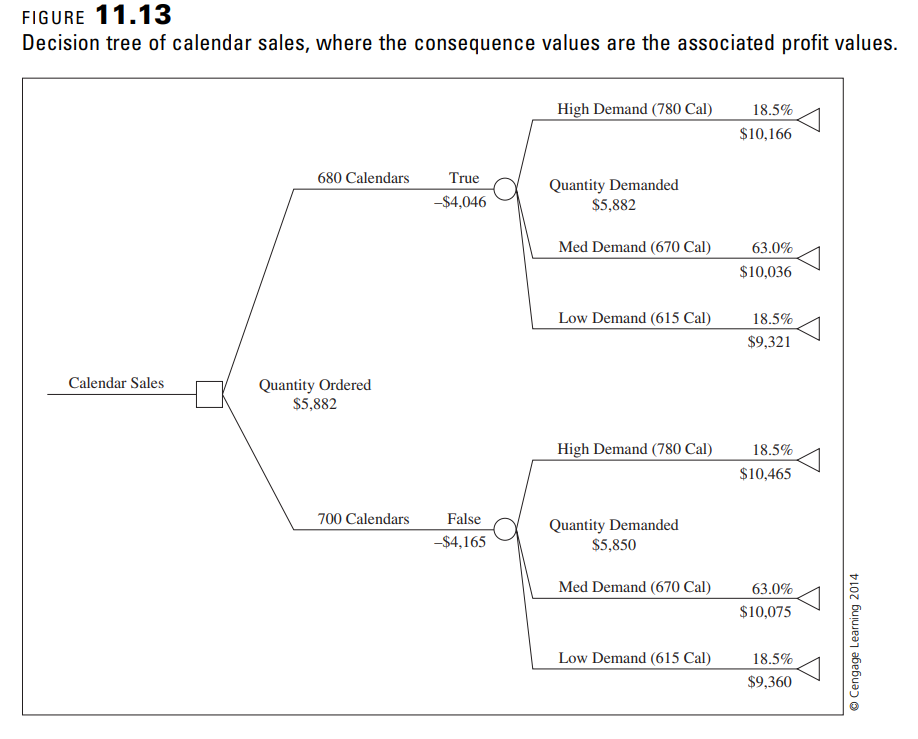
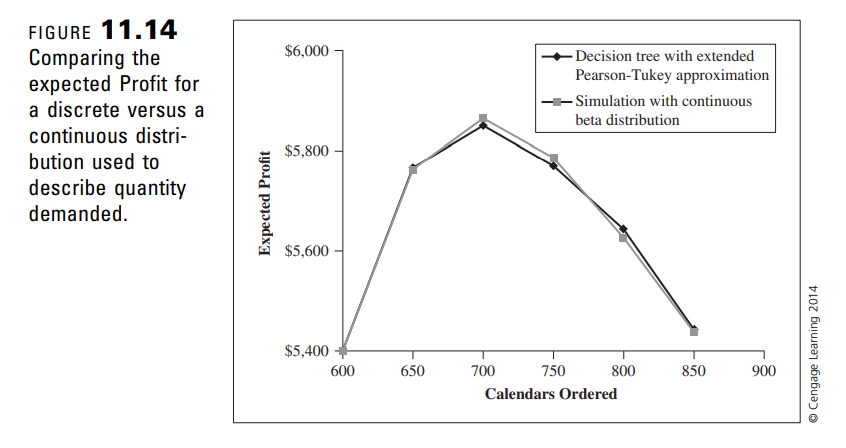
Question: Modify the decision-tree model in Figure 11.13 to use the extended Swanson-Megill (ES-M) approximation for demand instead of the EPT approximation. a. Use your ES-M

Modify the decision-tree model in Figure 11.13 to use the extended Swanson-Megill (ES-M) approximation for demand instead of the EPT approximation. a. Use your ES-M model to calculate expected profit for Order Quantity values 600, 650, 700, 750, and 800. How do your results compare to those in Figure 11.14?

Modify the decision-tree model in Figure 11.13 to

Modify the decision-tree model in Figure 11.13 to

FIGURE 11.13 Decision tree of calendar sales, where the consequence values are the associated profit values. High Demand (780 Cal) 18.5% $10,166 680 Calendars True Quantity Demanded $5,882 -$4,046 Med Demand (670 Cal) 63.0% $10,036 Low Demand (615 Cal) 18.5% $9,321 Calendar Sales Quantity Ordered $5,882 High Demand (780 Cal) 18.5% $10,465 700 Calendars False $4,165 Quantity Demanded $5,850 Med Demand (670 Cal) 63.0% $10,075 Cengage Learning 2014 Low Demand (615 Cal) 18.5% $9,360 $6,000 FIGURE 11.14 Comparing the expected Profit for a discrete versus a continuous distri- bution used to describe quantity demanded. -Decision tree with extended Pearson-Tukey approximation -Simulation with continuous beta distribution $5,800 Expected Profit $5,600 $5,400 600 Cengage Learning 2014 650 850 900 700 750 800 Calendars Ordered FIGURE 11.13 Decision tree of calendar sales, where the consequence values are the associated profit values. High Demand (780 Cal) 18.5% $10,166 680 Calendars True Quantity Demanded $5,882 -$4,046 Med Demand (670 Cal) 63.0% $10,036 Low Demand (615 Cal) 18.5% $9,321 Calendar Sales Quantity Ordered $5,882 High Demand (780 Cal) 18.5% $10,465 700 Calendars False $4,165 Quantity Demanded $5,850 Med Demand (670 Cal) 63.0% $10,075 Cengage Learning 2014 Low Demand (615 Cal) 18.5% $9,360 $6,000 FIGURE 11.14 Comparing the expected Profit for a discrete versus a continuous distri- bution used to describe quantity demanded. -Decision tree with extended Pearson-Tukey approximation -Simulation with continuous beta distribution $5,800 Expected Profit $5,600 $5,400 600 Cengage Learning 2014 650 850 900 700 750 800 Calendars Ordered

Step by Step Solution

There are 3 Steps involved in it

1 Expert Approved Answer
Step: 1 Unlock blur-text-image
Question Has Been Solved by an Expert!

Get step-by-step solutions from verified subject matter experts

Step: 2 Unlock
Step: 3 Unlock

Students Have Also Explored These Related General Management Questions!