

Question: Module 2 Assignment ii - FIN-751-AP1 Instructions: Complete the common-size and common-base year financial statements [Income Statement (IS) and Balance Sheet (BS)] or Brady Corp.
Module 2 Assignment ii - FIN-751-AP1
Instructions:
- Complete the common-size and common-base year financial statements [Income Statement (IS) and Balance Sheet (BS)] or Brady Corp. in Excel in the M2_Project_Excel Download M2_Project_Excelfile I provided. Be sure to include spark lines to easily show the trends. (25 pts) Write a brief analysis in the Excel worksheet of the main trends that you notice. (25 pts)
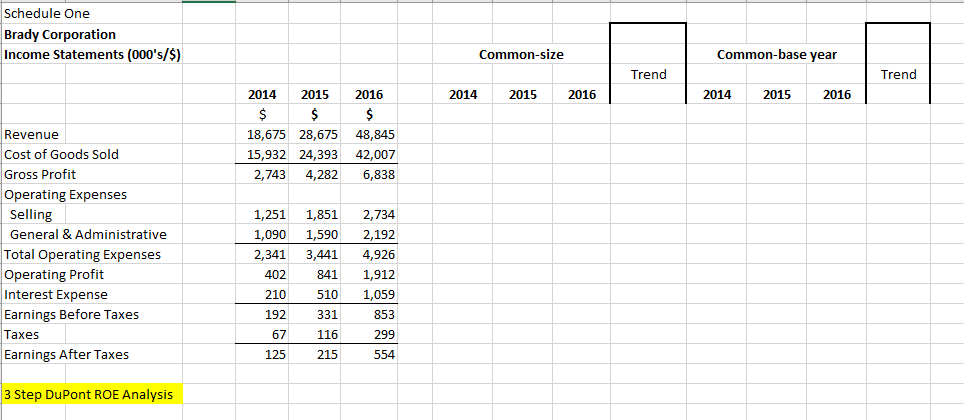 IS
IS ![year financial statements [Income Statement (IS) and Balance Sheet (BS)] or Brady](https://dsd5zvtm8ll6.cloudfront.net/si.experts.images/questions/2024/09/66f20395db240_66166f203957d04c.jpg)
BS
See Assigned Readings / Videos Related to common-size and common-base year financial statements for Project for videos on using Excel for complete these statements.
See Assigned Readings / Videos Related to Excel Basics for Project for videos on creating sparklines in Excel and how to reference other excel sheets when computing ratios.
- -------------------------------------------------------------------------------------------------------------------------------------
- 2. Perform the 3 step DuPont Return on Equity (ROE) analysis for Brady Corp. using cell references. (25 pts) Write a brief analysis (50-100 words) of what you learn from the DuPont analysis on your Excel worksheet. (25 pts) For a good example see assigned Readings / Videos Related to DuPont Return on Equity (ROE) for Project
Submit your modified Excel file
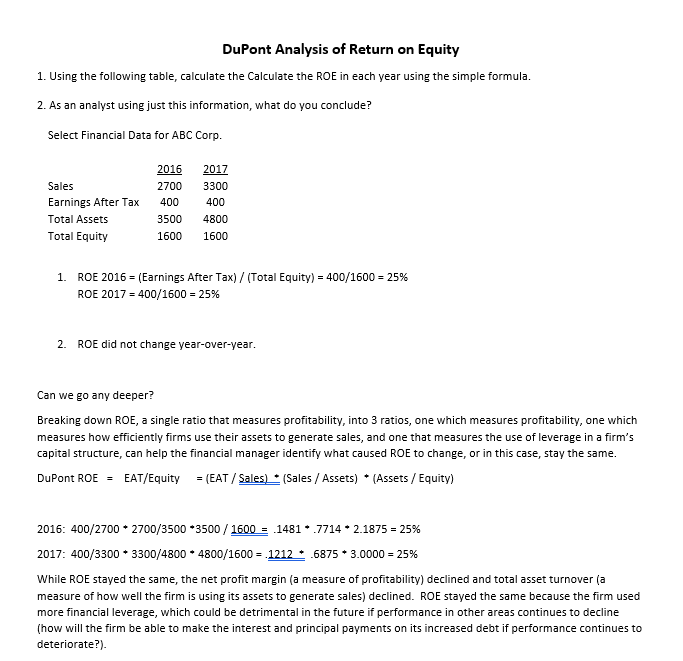
\begin{tabular}{|c|c|c|c|} \hline Total Assets & 8,649 & 11,862 & 19,239 \\ \hline \multicolumn{4}{|l|}{ Current liabilities } \\ \hline Account payables & 1,019 & 2,019 & 4,656 \\ \hline Short-term notes payables & 300 & 1,300 & 2,500 \\ \hline Total current liabilities & 1,319 & 3,319 & 7,156 \\ \hline Long-term liabilities & 2,300 & 3,330 & 6,355 \\ \hline Total liabilities & 3,619 & 6,649 & 13,511 \\ \hline \multicolumn{4}{|l|}{ Shareholders' equity } \\ \hline Common stock & 4,500 & 4,500 & 4,500 \\ \hline Retained earnings & 218 & 433 & 987 \\ \hline Total equity & 4,718 & 4,933 & 5,487 \\ \hline Total liabilities \& equity & 8,649 & 11,862 & 19,239 \\ \hline \end{tabular} DuPont Analysis of Return on Equity 1. Using the following table, calculate the Calculate the ROE in each year using the simple formula. 2. As an analyst using just this information, what do you conclude? Select Financial Data for ABC Corp. 1. ROE 2016=( Earnings After Tax) / (Total Equity )=400/1600=25% ROE 2017=400/1600=25% 2. ROE did not change year-over-year. Can we go any deeper? Breaking down ROE, a single ratio that measures profitability, into 3 ratios, one which measures profitability, one which measures how efficiently firms use their assets to generate sales, and one that measures the use of leverage in a firm's capital structure, can help the financial manager identify what caused ROE to change, or in this case, stay the same. DuPont ROE = EAT / Equity =( EAT / Sales )( Sales / Assets )( Assets / Equity ) 2016: 400/27002700/35003500/1600=.1481.77142.1875=25% While ROE stayed the same, the net profit margin (a measure of profitability) declined and total asset turnover (a measure of how well the firm is using its assets to generate sales) declined. ROE stayed the same because the firm used more financial leverage, which could be detrimental in the future if performance in other areas continues to decline (how will the firm be able to make the interest and principal payments on its increased debt if performance continues to deteriorate?)
Step by Step Solution
There are 3 Steps involved in it

Get step-by-step solutions from verified subject matter experts