

Question: Module 2: Graphical ical Data Analysis - K Question 41, *2.1- Part 1 of 2 The table shows prices of 50 college textboo an
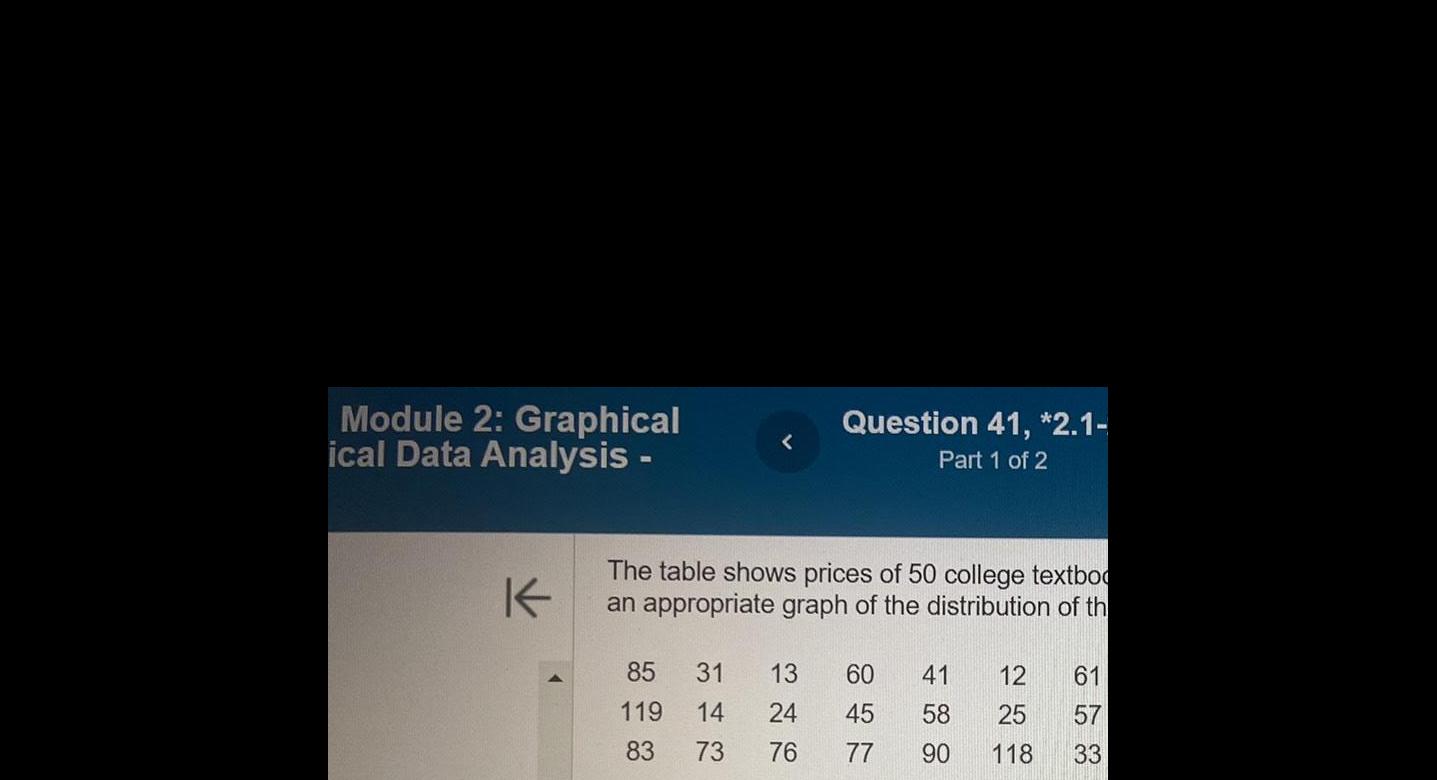
Module 2: Graphical ical Data Analysis - K Question 41, *2.1- Part 1 of 2 The table shows prices of 50 college textboo an appropriate graph of the distribution of th 85 31 13 60 41 12 61 119 14 83 73 24 647 45 76 77 90 488 58 25 57 118 33
Step by Step Solution
There are 3 Steps involved in it
1 Expert Approved Answer
Step: 1 Unlock

Question Has Been Solved by an Expert!
Get step-by-step solutions from verified subject matter experts
Step: 2 Unlock
Step: 3 Unlock