

Question: Module 4 : Interpreting Circle and Bar Graphs Due Sunday by 1 1 : 5 9 p m Points 1 0 Submitting an external tool
Module : Interpreting Circle and Bar Graphs
Due Sunday by :
Points
Submitting an external tool
Available
May at :pm May at :pm
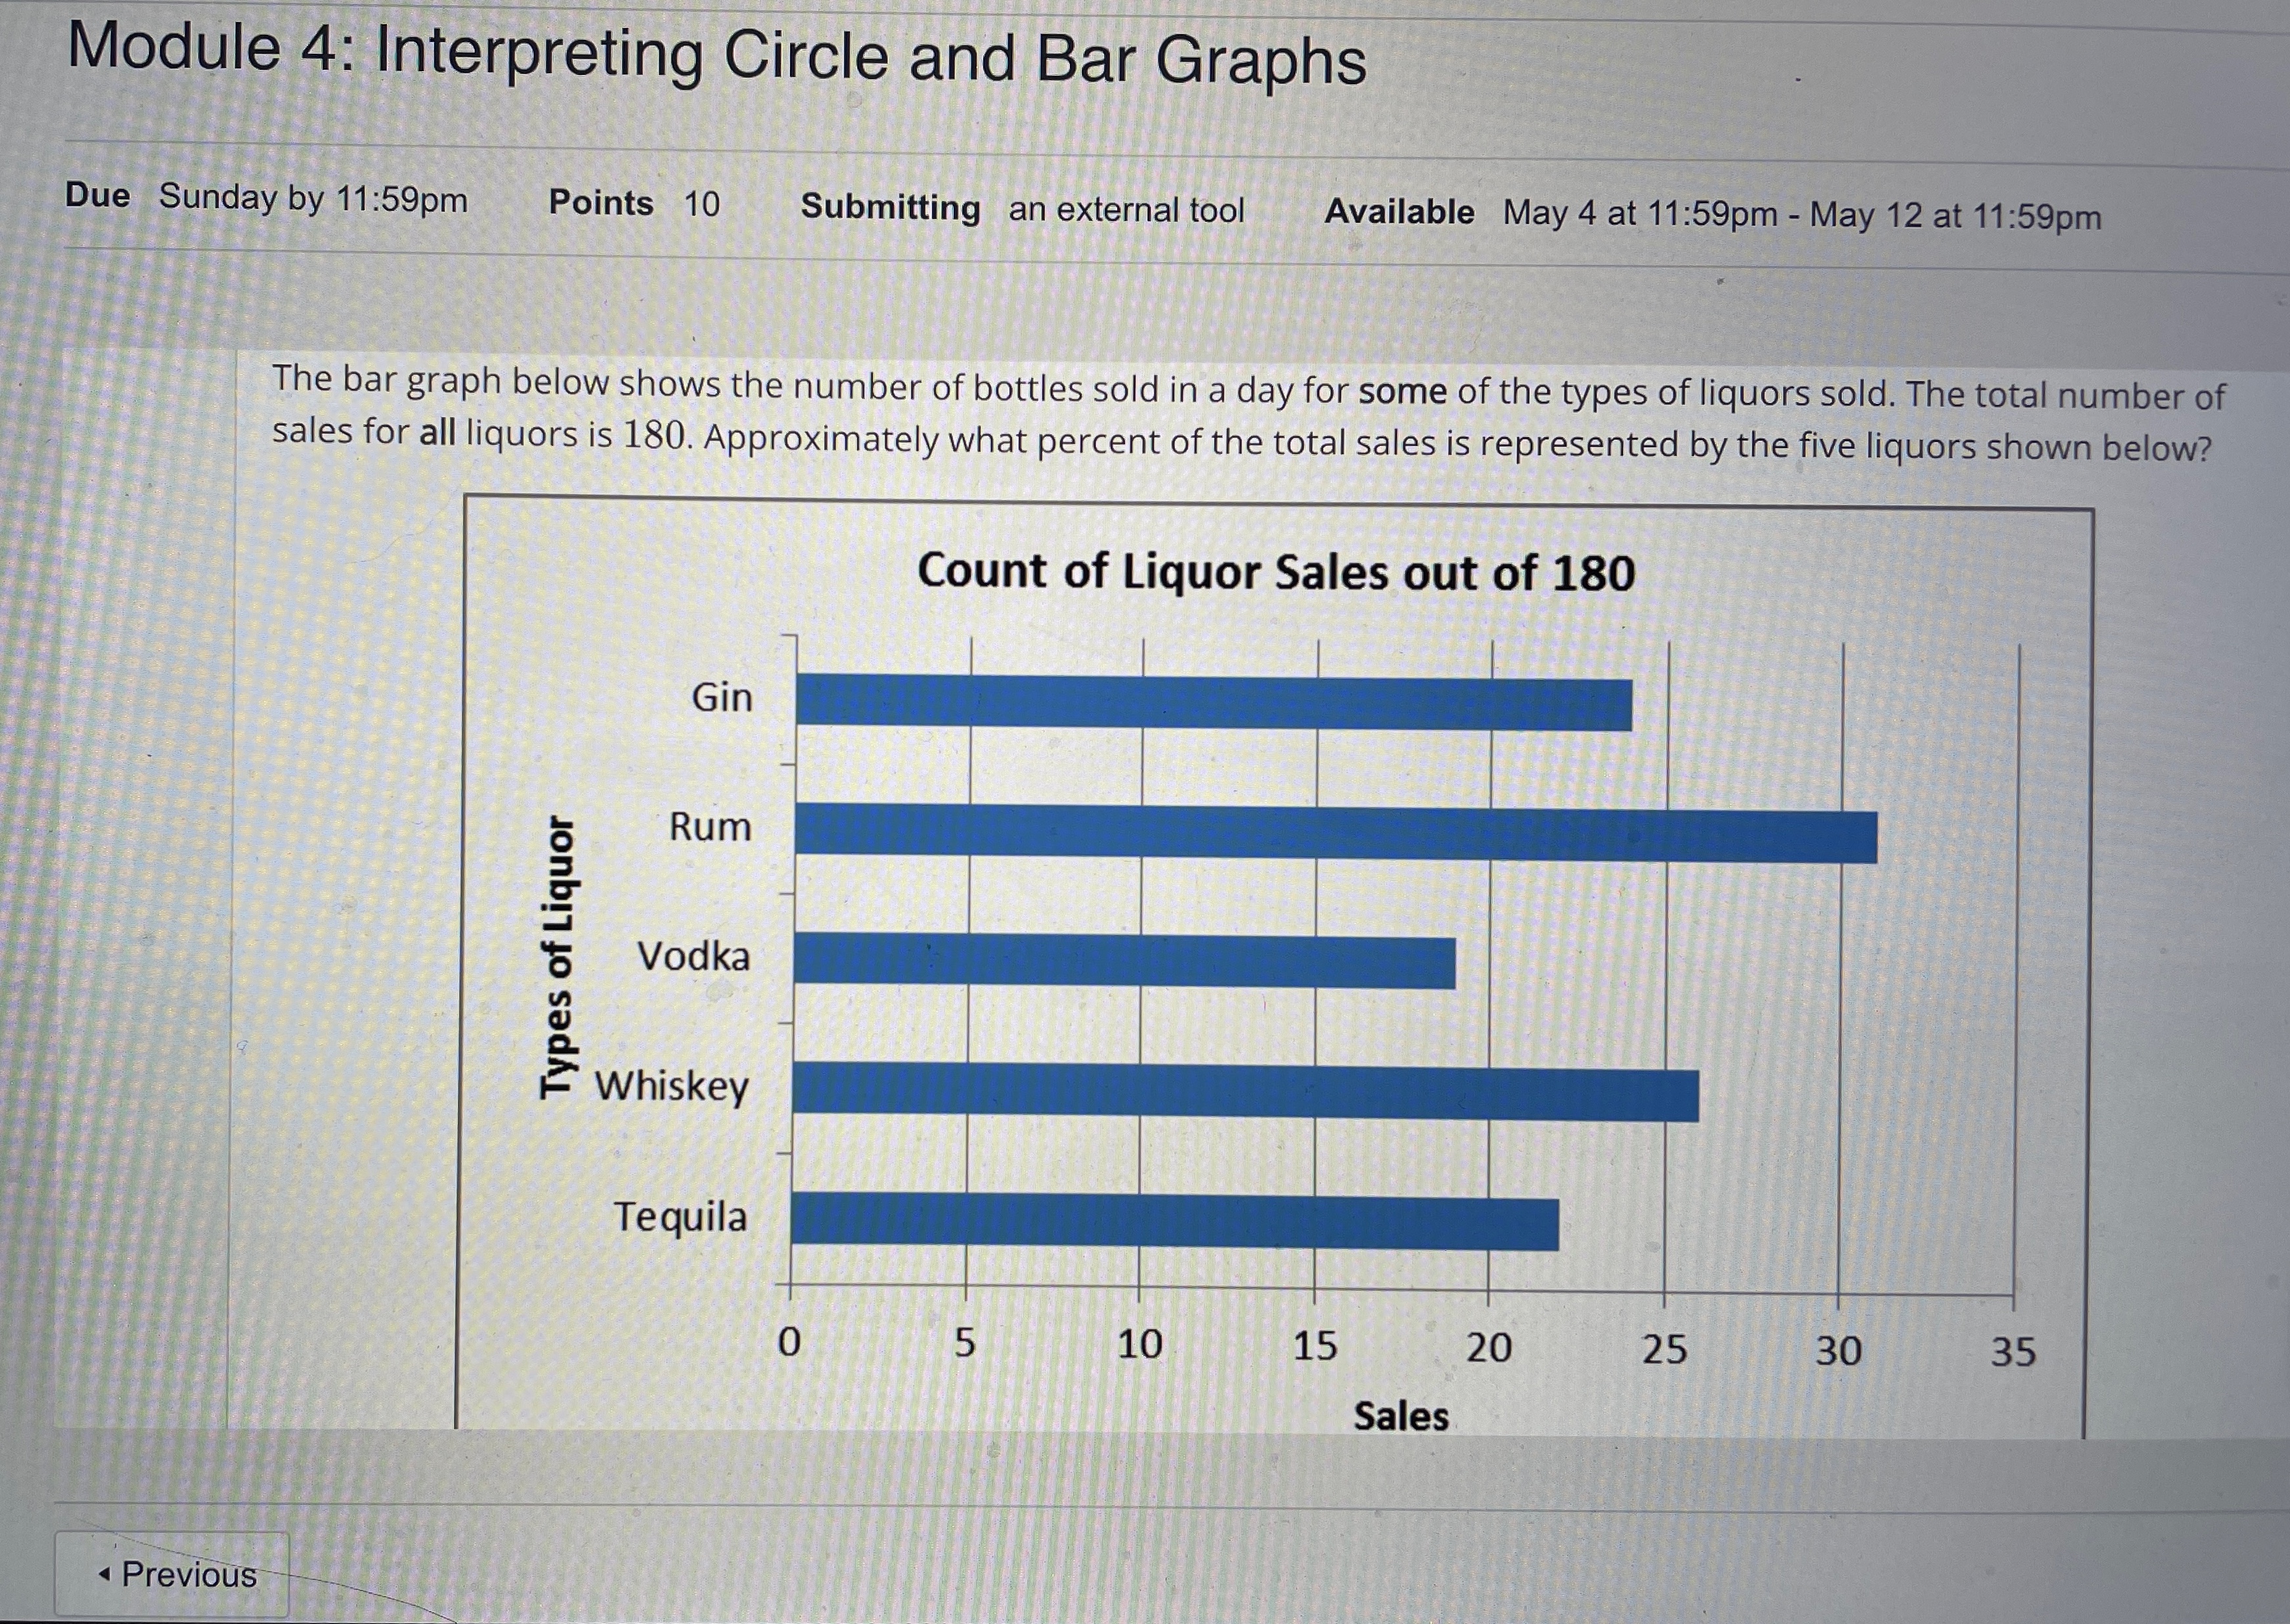
The bar graph below shows the number of bottles sold in a day for some of the types of liquors sold. The total number of sales for all liquors is Approximately what percent of the total sales is represented by the five liquors shown below?
Step by Step Solution
There are 3 Steps involved in it
1 Expert Approved Answer
Step: 1 Unlock

Question Has Been Solved by an Expert!
Get step-by-step solutions from verified subject matter experts
Step: 2 Unlock
Step: 3 Unlock