

Question: MODULE 4 PROFIT PLANNING AND DECISION MAKING DECISION-MAKING IN ACTION: CASE, ANALYSIS AND DECISION CASE The CEO of Widget Inc. was reviewing the projected statement
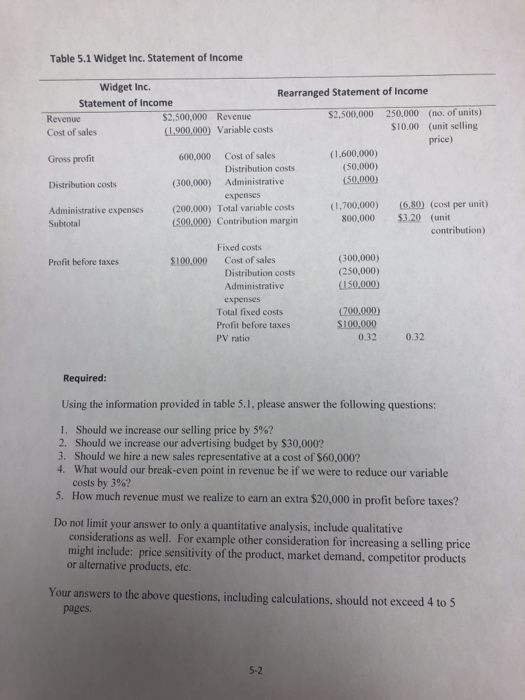
MODULE 4 PROFIT PLANNING AND DECISION MAKING DECISION-MAKING IN ACTION: CASE, ANALYSIS AND DECISION CASE The CEO of Widget Inc. was reviewing the projected statement of income with her management team (see Table 5.1). The company projected a $100,000 profit before taxes. They were contemplating several decisions related to next year's financial performance. To make an effective analysis and practical decisions based on the break-even point system, the controller rearranged the projected statement of income by consolidating all variable costs and all fixed costs under two distinct groupings. As shown in the middle of Table 5.1, the rearranged statement of income shows that the company's variable costs amounted to $1,700,000 and generate $800,000 in contribution margin. Total fixed costs amounted to $700,000. By regrouping the variable and fixed costs, the controller was able to calculate the PV ratio. As shown, the PV ratio of 32 is calculated by dividing the $800,000 contribution margin by the $2.500.000 revenue amount. This calculation indicates that for every dollar's worth of revenue, the company would generate $0.32 in contribution margin which is an amount that contributes for paying the fixed costs. Dividing the fixed costs by the PV ratio shows that the company would have to sell $2,187.500 or 87.5% of its revenue objective to break-even. The right side of Table 5.1 indicates the number of units sold and, for each unit, the selling price, variable costs, and contribution margin. The PV ratio is the same, that is 32. or $3.20 per unit. Table 5.1 Widget Inc. Statement of Income Widget Inc. Rearranged Statement of Income Statement of Income Revenue $2,500,000 Revenue $2,500,000 250.000 (no. of units) Cost of sales (1.900.000) Variable costs $10.00 (unit selling price) Gross profit 600,000 Cost of sales (1.600.000) Distribution costs (50,000) Distribution costs (300,000) Administrative (50,000) expenses Administrative expenses (200,000) Total variable costs (1.700.000) (6.80) (cost per unit) Subtotal (500.000) Contribution margin 800,000 $3.20 (unit contribution) Fixed costs Profit before taxes $100,000 Cost of sales (300,000) Distribution costs (250,000) Administrative (150.000) expenses Total fixed costs 700.000) Profit before taxes $100,000 0.32 PV ratio 0.32 Required: Using the information provided in table 5.1. please answer the following questions: 1. Should we increase our selling price by 5%? 2. Should we increase our advertising budget by $30,000? 3. Should we hire a new sales representative at a cost of $60,000? 4. What would our break-even point in revenue be if we were to reduce our variable costs by 3%? 5. How much revenue must we realize to earn an extra $20,000 in profit before taxes? Do not limit your answer to only a quantitative analysis, include qualitative considerations as well. For example other consideration for increasing a selling price might include: price sensitivity of the product, market demand, competitor products or alternative products, etc. Your answers to the above questions, including calculations, should not exceed 4 to 5 pages. 52
Step by Step Solution
There are 3 Steps involved in it

Get step-by-step solutions from verified subject matter experts