

Question: Module 5 Lab For this module, you will use the Python complete journey data. The objective is to uncover unique insights in this data
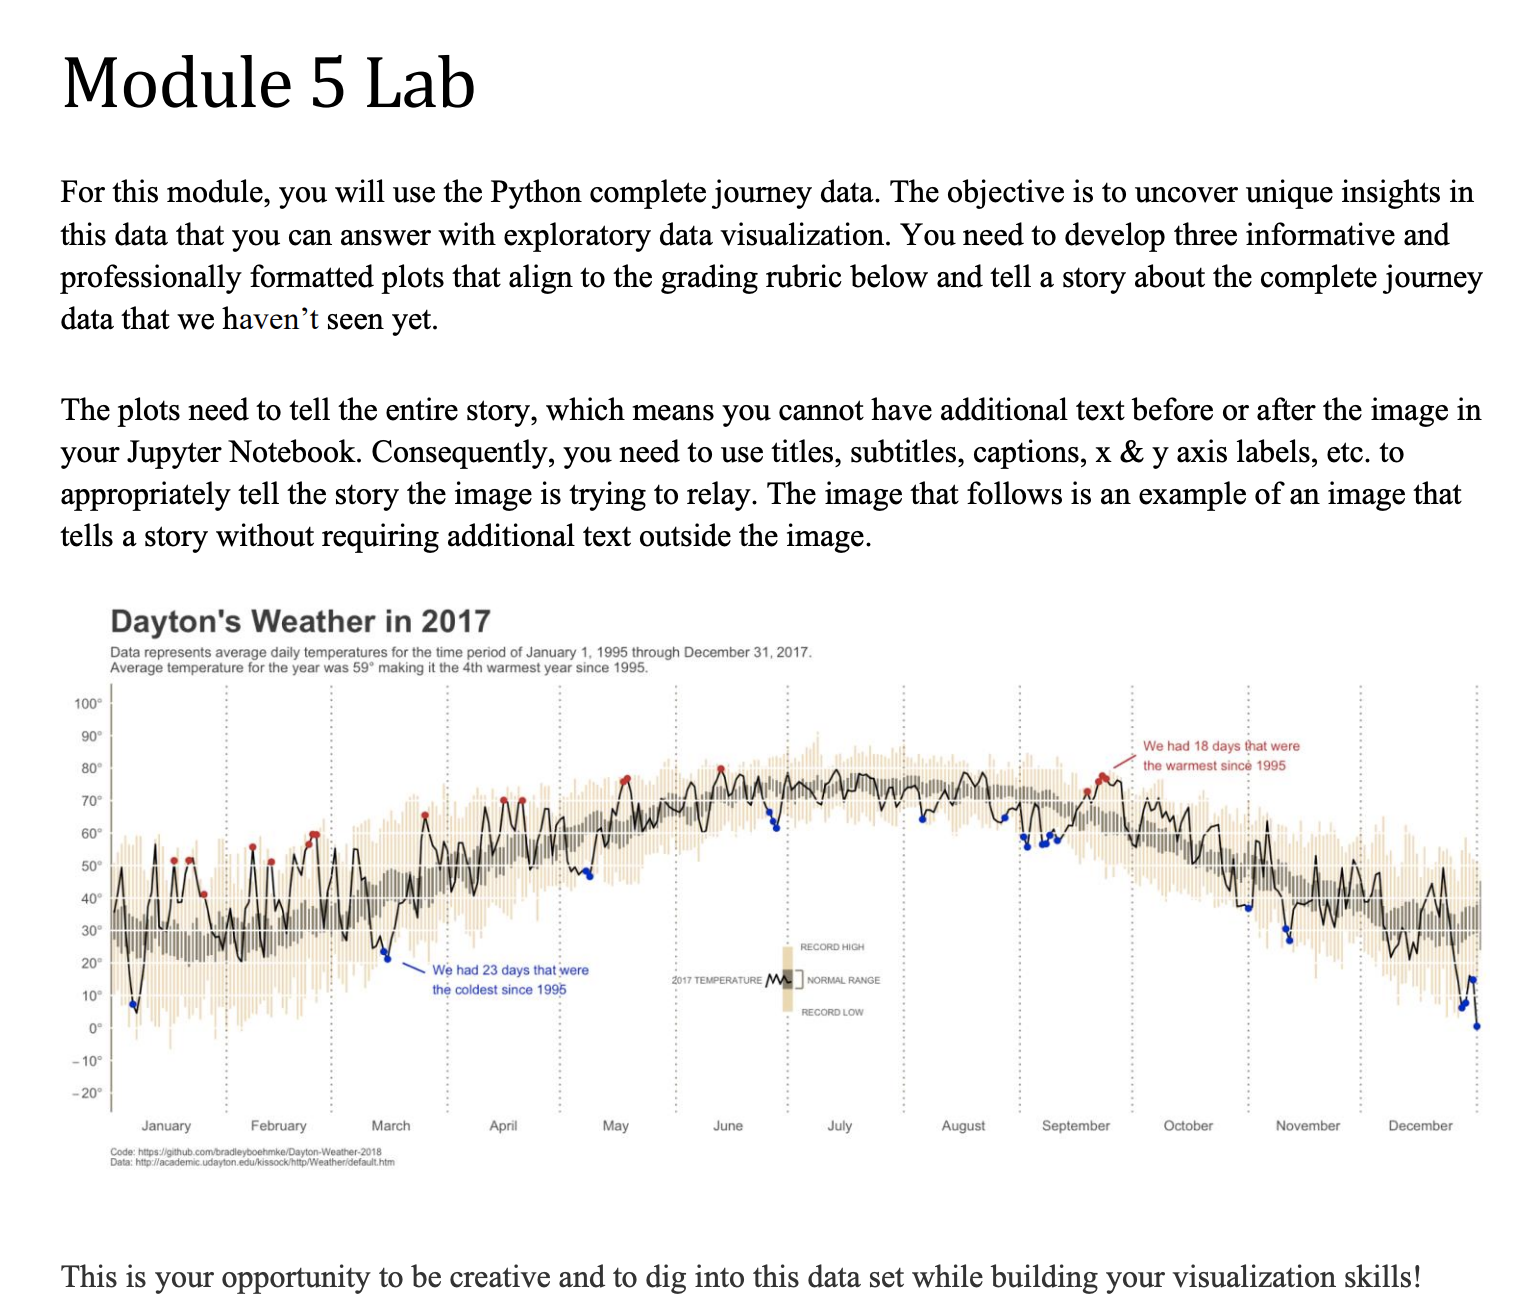
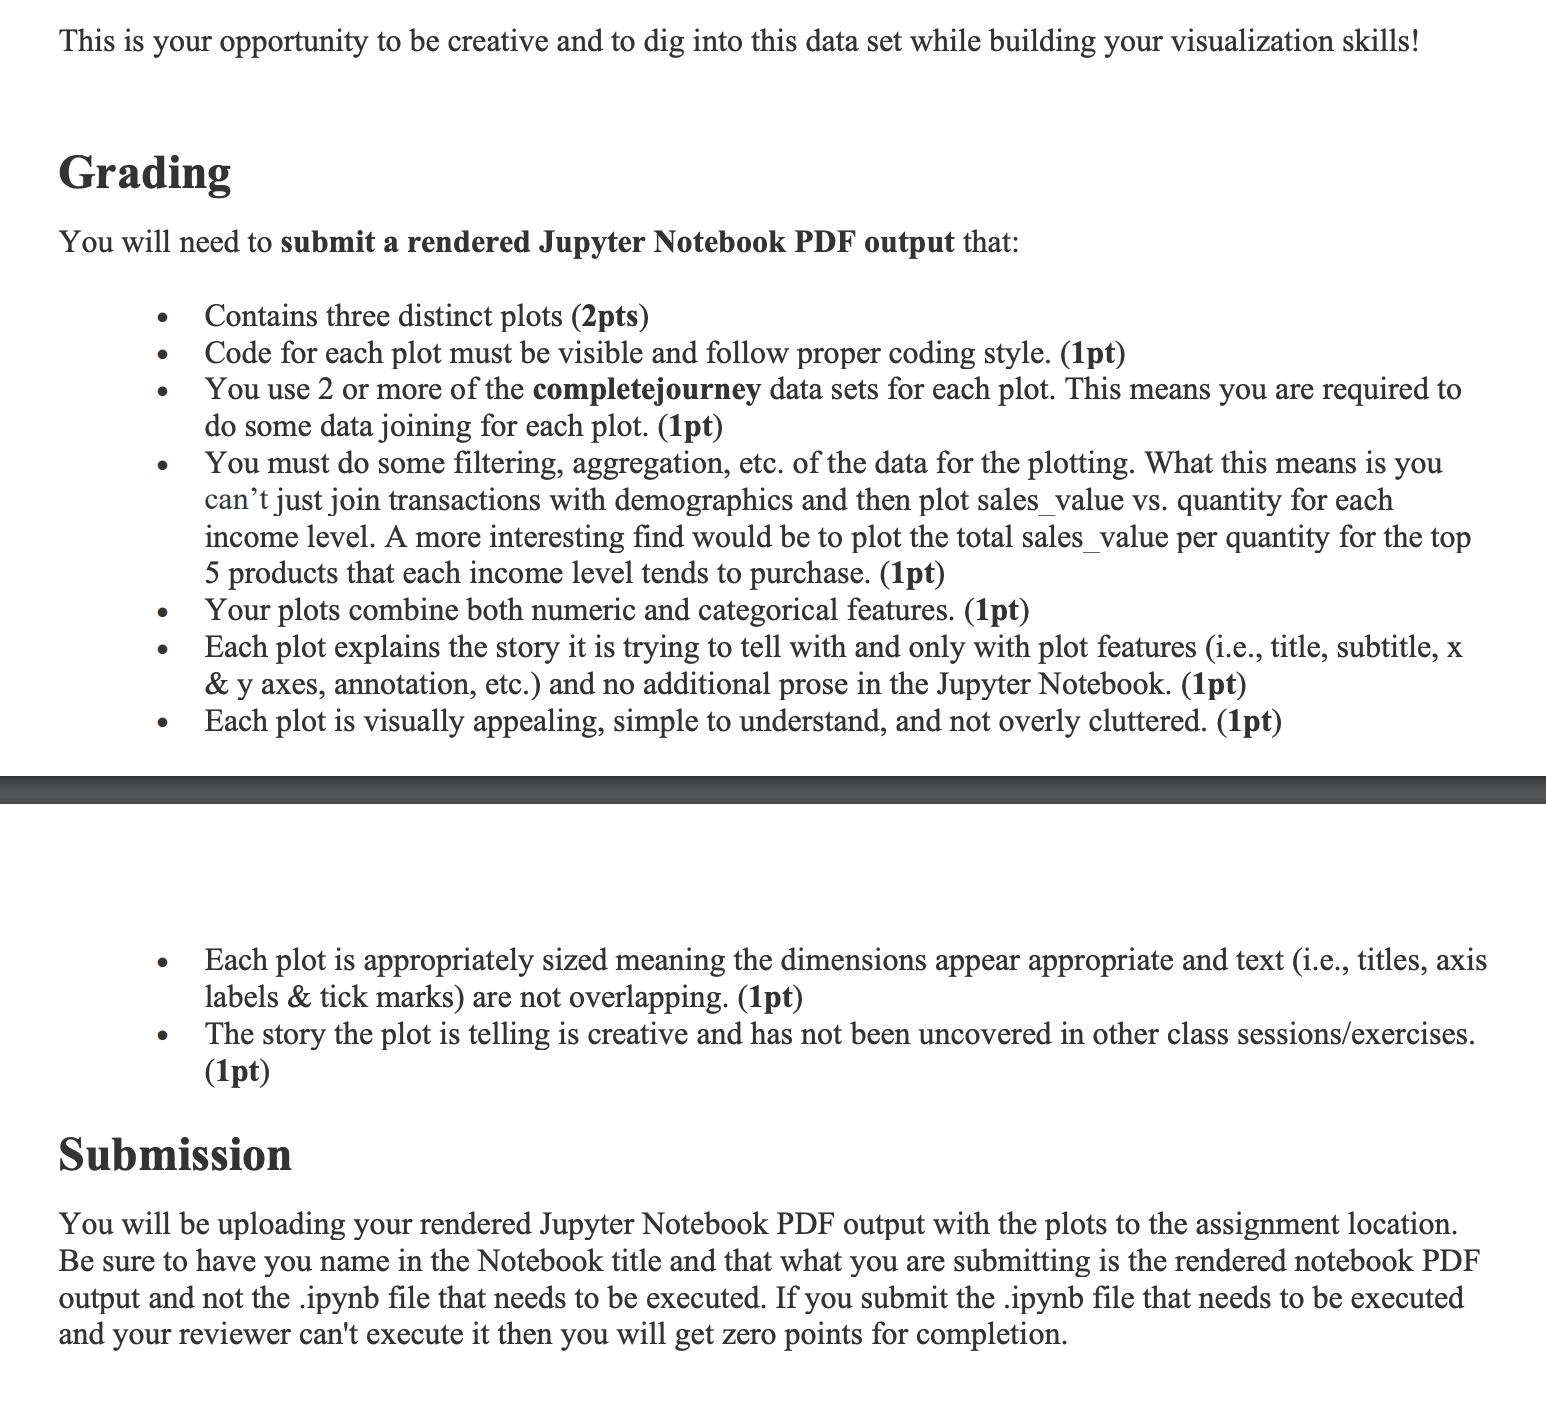
Module 5 Lab For this module, you will use the Python complete journey data. The objective is to uncover unique insights in this data that you can answer with exploratory data visualization. You need to develop three informative and professionally formatted plots that align to the grading rubric below and tell a story about the complete journey data that we haven't seen yet. The plots need to tell the entire story, which means you cannot have additional text before or after the image in your Jupyter Notebook. Consequently, you need to use titles, subtitles, captions, x & y axis labels, etc. to appropriately tell the story the image is trying to relay. The image that follows is an example of an image that tells a story without requiring additional text outside the image. 100 90 80 70 60 50 40 30 20 10 0 -10 -20 Dayton's Weather in 2017 Data represents average daily temperatures for the time period of January 1, 1995 through December 31, 2017. Average temperature for the year was 59 making it the 4th warmest year since 1995. February Code: https://github.com/bradleyboehmke/Dayton-Weather-2018 Data: http://academic.udayton.edu/kissock/http/Weather/default.htm January March We had 23 days that were the coldest since 1995 April May RECORD HIGH 2017 TEMPERATURE M NORMAL RANGE June RECORD LOW July August September We had 18 days that were the warmest since 1995 October November December This is your opportunity to be creative and to dig into this data set while building your visualization skills! This is your opportunity to be creative and to dig into this data set while building your visualization skills! Grading You will need to submit a rendered Jupyter Notebook PDF output that: Contains three distinct plots (2pts) Code for each plot must be visible and follow proper coding style. (1pt) You use 2 or more of the completejourney data sets for each plot. This means you are required to do some data joining for each plot. (1pt) You must do some filtering, aggregation, etc. of the data for the plotting. What this means is you can't just join transactions with demographics and then plot sales_value vs. quantity for each income level. A more interesting find would be to plot the total sales_value per quantity for the top 5 products that each income level tends to purchase. (1pt) Your plots combine both numeric and categorical features. (1pt) Each plot explains the story it is trying to tell with and only with plot features (i.e., title, subtitle, x & y axes, annotation, etc.) and no additional prose in the Jupyter Notebook. (1pt) Each plot is visually appealing, simple to understand, and not overly cluttered. (1pt) Each plot is appropriately sized meaning the dimensions appear appropriate and text (i.e., titles, axis labels & tick marks) are not overlapping. (1pt) The story the plot is telling is creative and has not been uncovered in other class sessions/exercises. (1pt) Submission You will be uploading your rendered Jupyter Notebook PDF output with the plots to the assignment location. Be sure to have you name in the Notebook title and that what you are submitting is the rendered notebook PDF output and not the .ipynb file that needs to be executed. If you submit the .ipynb file that needs to be executed and your reviewer can't execute it then you will get zero points for completion.
Step by Step Solution
There are 3 Steps involved in it

Get step-by-step solutions from verified subject matter experts