

Question: Module 6 Chapter 2.1 Presenting Categorical Data Graphically Question 1 Based on the bar graph below determine how many times a two was rolled. Outcomes
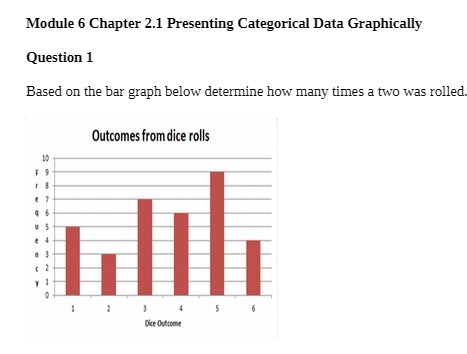
Module 6 Chapter 2.1 Presenting Categorical Data Graphically Question 1 Based on the bar graph below determine how many times a two was rolled. Outcomes from dice rolls 15 F Dice Outtome
Step by Step Solution
There are 3 Steps involved in it
1 Expert Approved Answer
Step: 1 Unlock

Question Has Been Solved by an Expert!
Get step-by-step solutions from verified subject matter experts
Step: 2 Unlock
Step: 3 Unlock