

Question: Module 7: Mini Discussion 1 - Data Visualization Guess Guess what the following picture shows. You should also like any other posts that you see
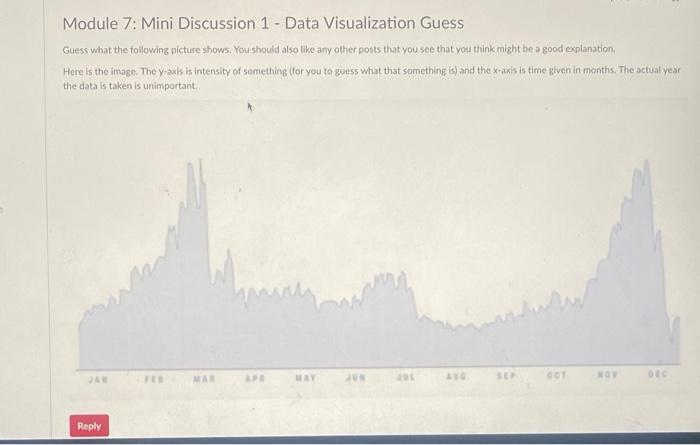
Module 7: Mini Discussion 1 - Data Visualization Guess Guess what the following picture shows. You should also like any other posts that you see that you think might be a good explanation, Here is the image. The y-axis is intensity of something (for you to guess what that something is) and the x-axis is time given in monthis. The actual year the data is taken is unimportant
Step by Step Solution
There are 3 Steps involved in it
1 Expert Approved Answer
Step: 1 Unlock

Question Has Been Solved by an Expert!
Get step-by-step solutions from verified subject matter experts
Step: 2 Unlock
Step: 3 Unlock