

Question: Module 9 Homework 1 - Limitations of a Boxplot _ (9 0f 11) & Due Sunday by 11:59pm Points 10 Submitting a text entry box
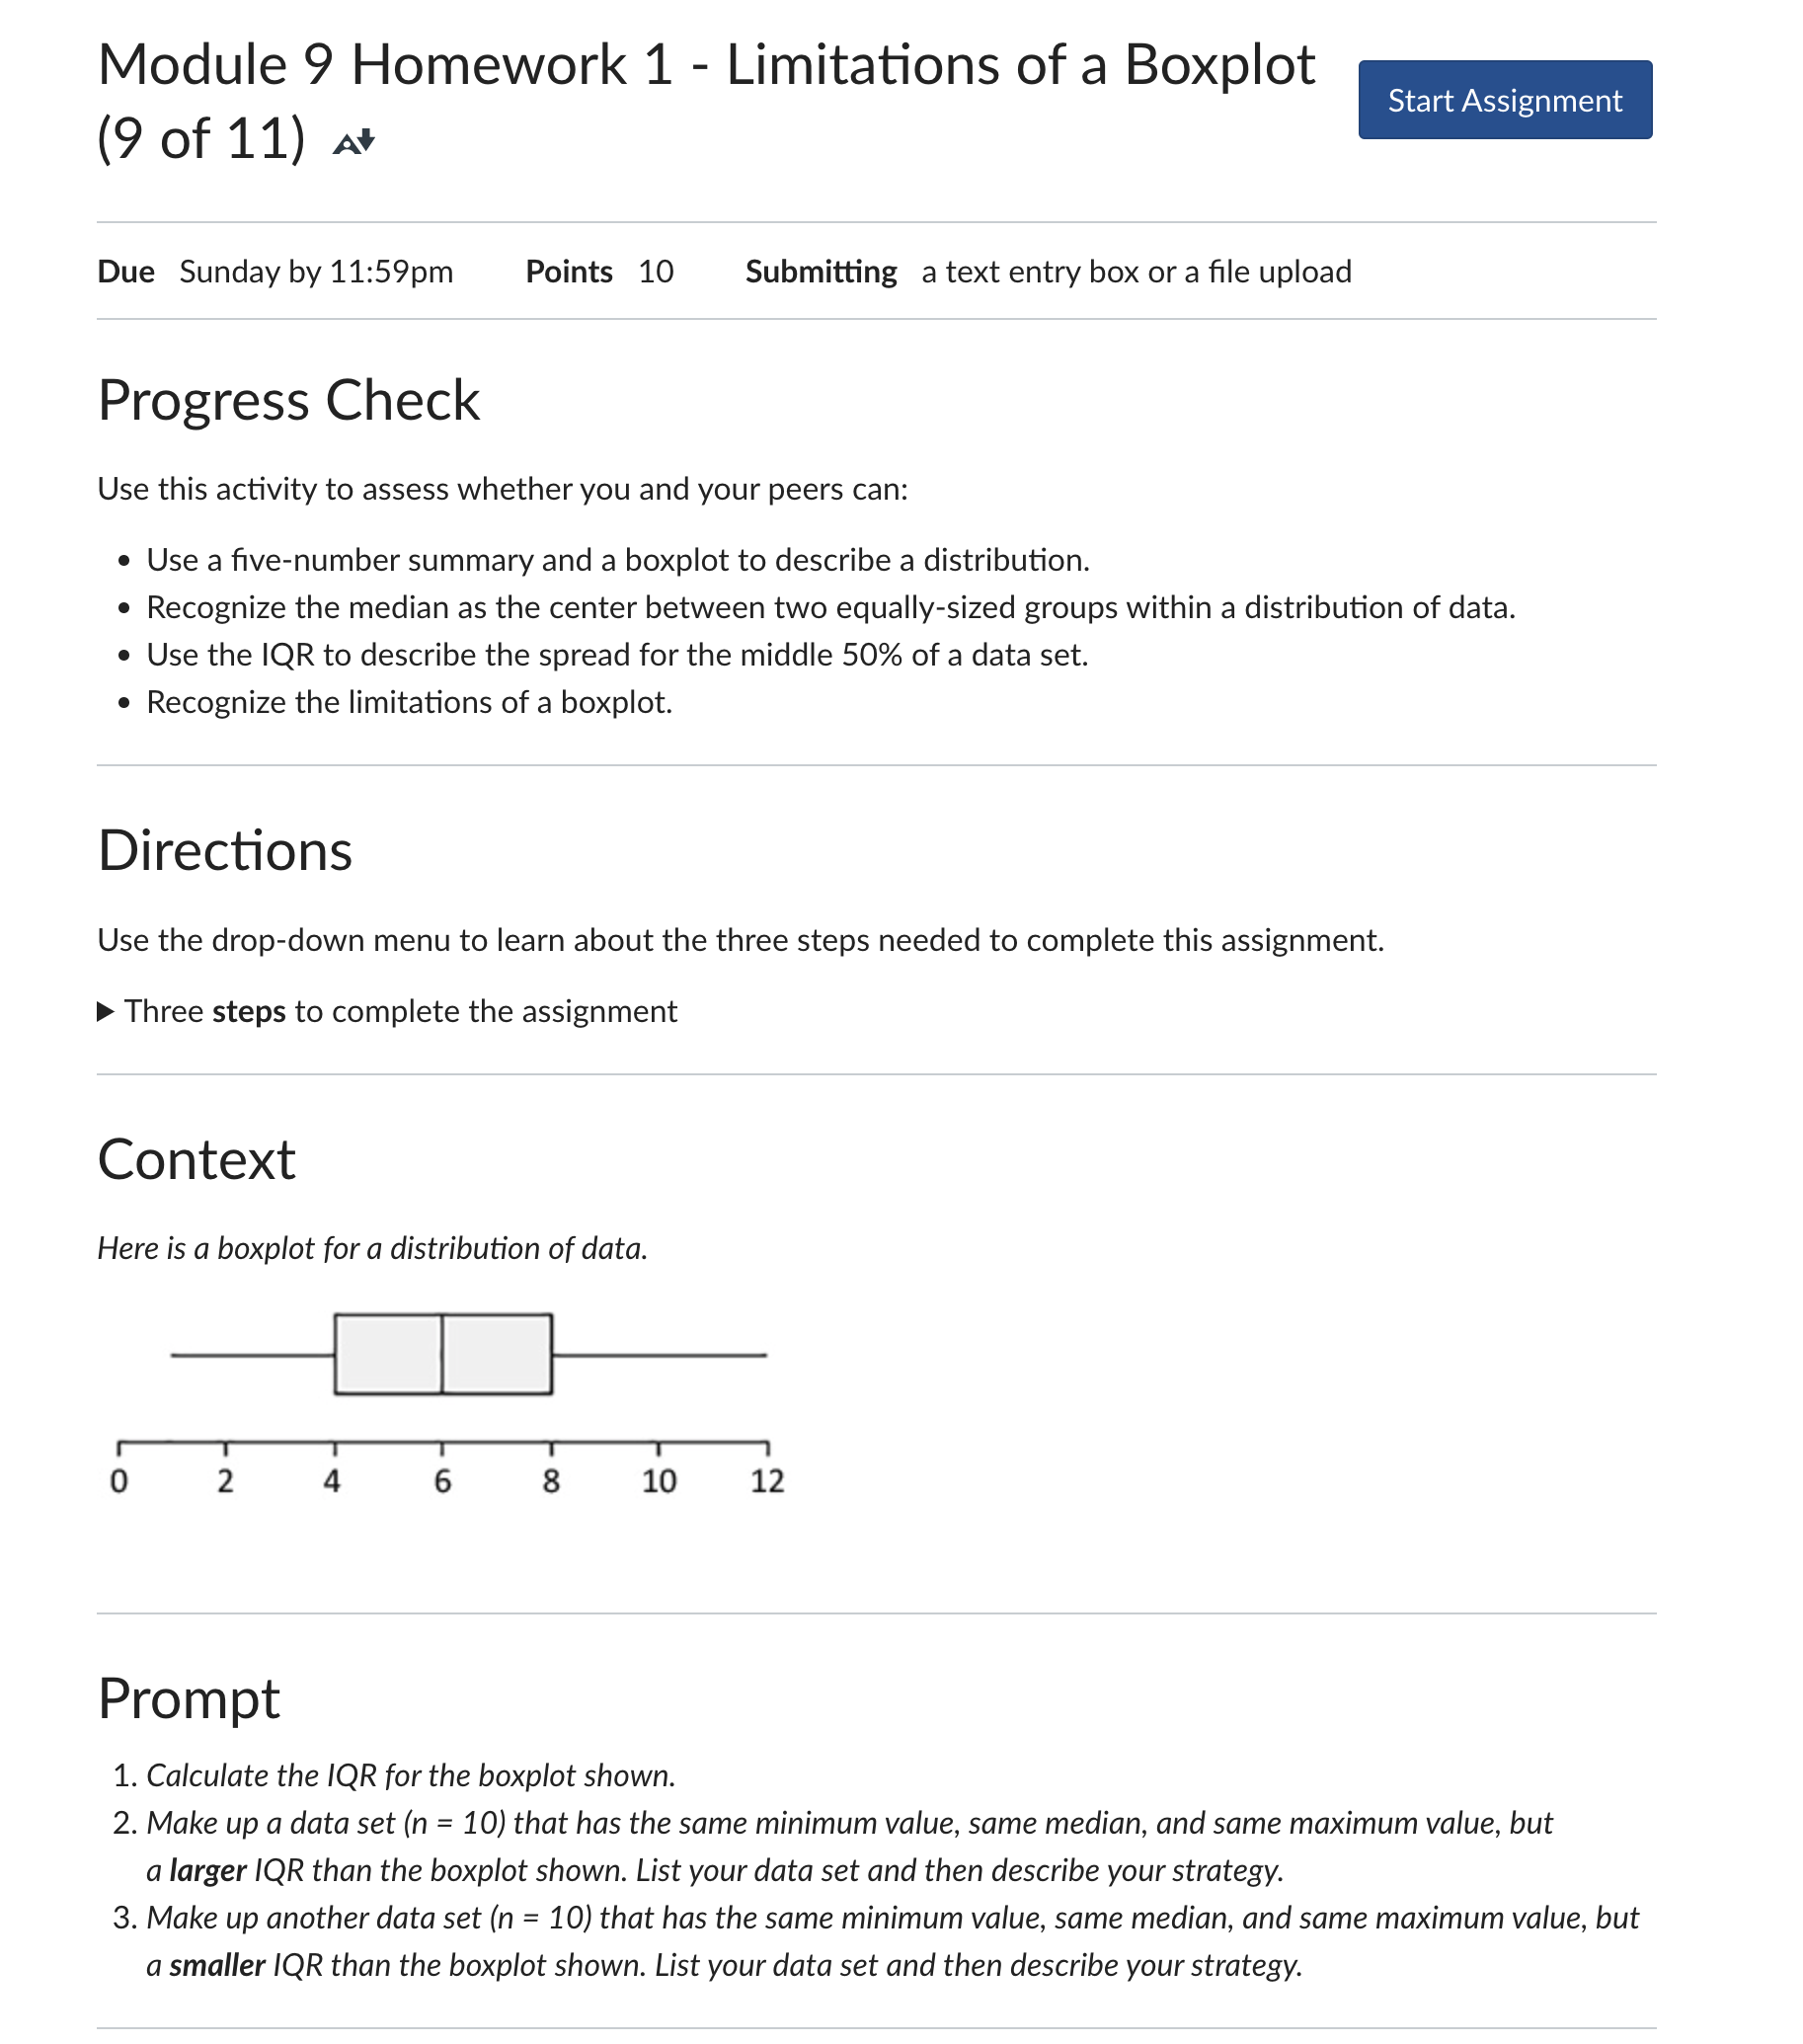
Module 9 Homework 1 - Limitations of a Boxplot _ (9 0f 11) & Due Sunday by 11:59pm Points 10 Submitting a text entry box or a file upload Progress Check Use this activity to assess whether you and your peers can: Use a five-number summary and a boxplot to describe a distribution. Recognize the median as the center between two equally-sized groups within a distribution of data. e Use the IQR to describe the spread for the middle 50% of a data set. e Recognize the limitations of a boxplot. Directions Use the drop-down menu to learn about the three steps needed to complete this assignment. Three steps to complete the assignment Context Here is a boxplot for a distribution of data. 1L [ Prompt 1. Calculate the IQR for the boxplot shown. 2. Make up a data set (n = 10) that has the same minimum value, same median, and same maximum value, but a larger IQR than the boxplot shown. List your data set and then describe your strategy. 3. Make up another data set (n = 10) that has the same minimum value, same median, and same maximum value, but a smaller IQR than the boxplot shown. List your data set and then describe your strategy
Step by Step Solution
There are 3 Steps involved in it

Get step-by-step solutions from verified subject matter experts