

Question: Molecular Weight Analysis Given the data in the table below, produce a histogram ( e . g . , Excel or MATLAB ) showing the
Molecular Weight Analysis
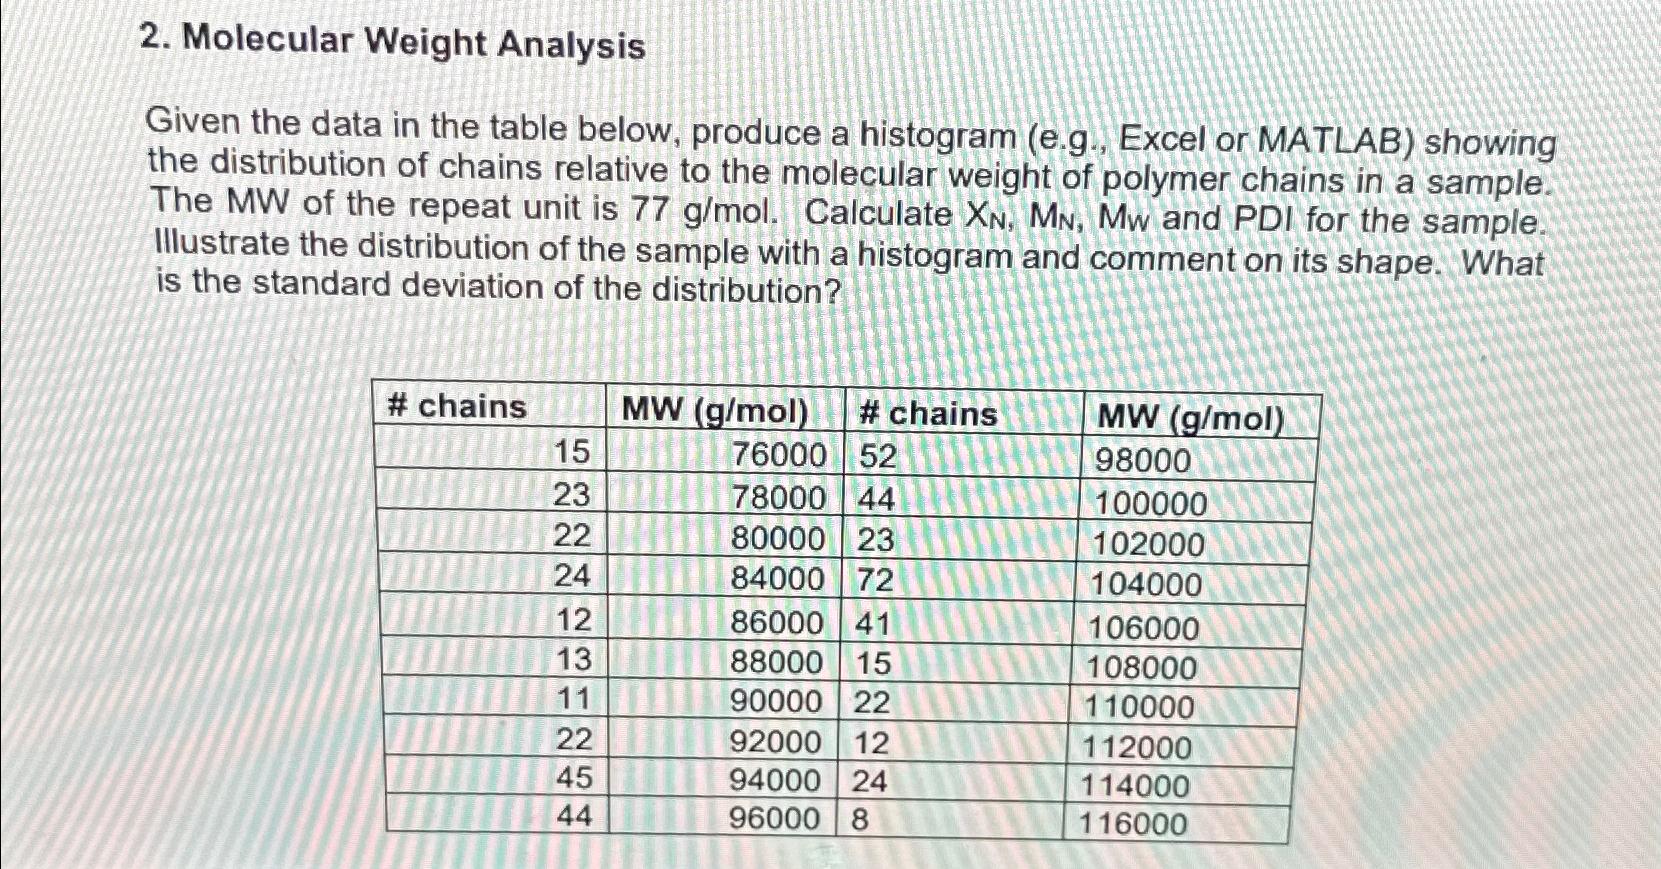
Given the data in the table below, produce a histogram eg Excel or MATLAB showing the distribution of chains relative to the molecular weight of polymer chains in a sample. The MW of the repeat unit is Calculate and PDI for the sample. Illustrate the distribution of the sample with a histogram and comment on its shape. What is the standard deviation of the distribution?
table# chains,,# chains,
Step by Step Solution
There are 3 Steps involved in it
1 Expert Approved Answer
Step: 1 Unlock

Question Has Been Solved by an Expert!
Get step-by-step solutions from verified subject matter experts
Step: 2 Unlock
Step: 3 Unlock