

Question: ' MONASH University STA1010 Statistical Methods for Science all}? Science Preliminary Work for Laboratory 3 DUE Week 4 Name: .............................................................. 1D ................... 1. a) For
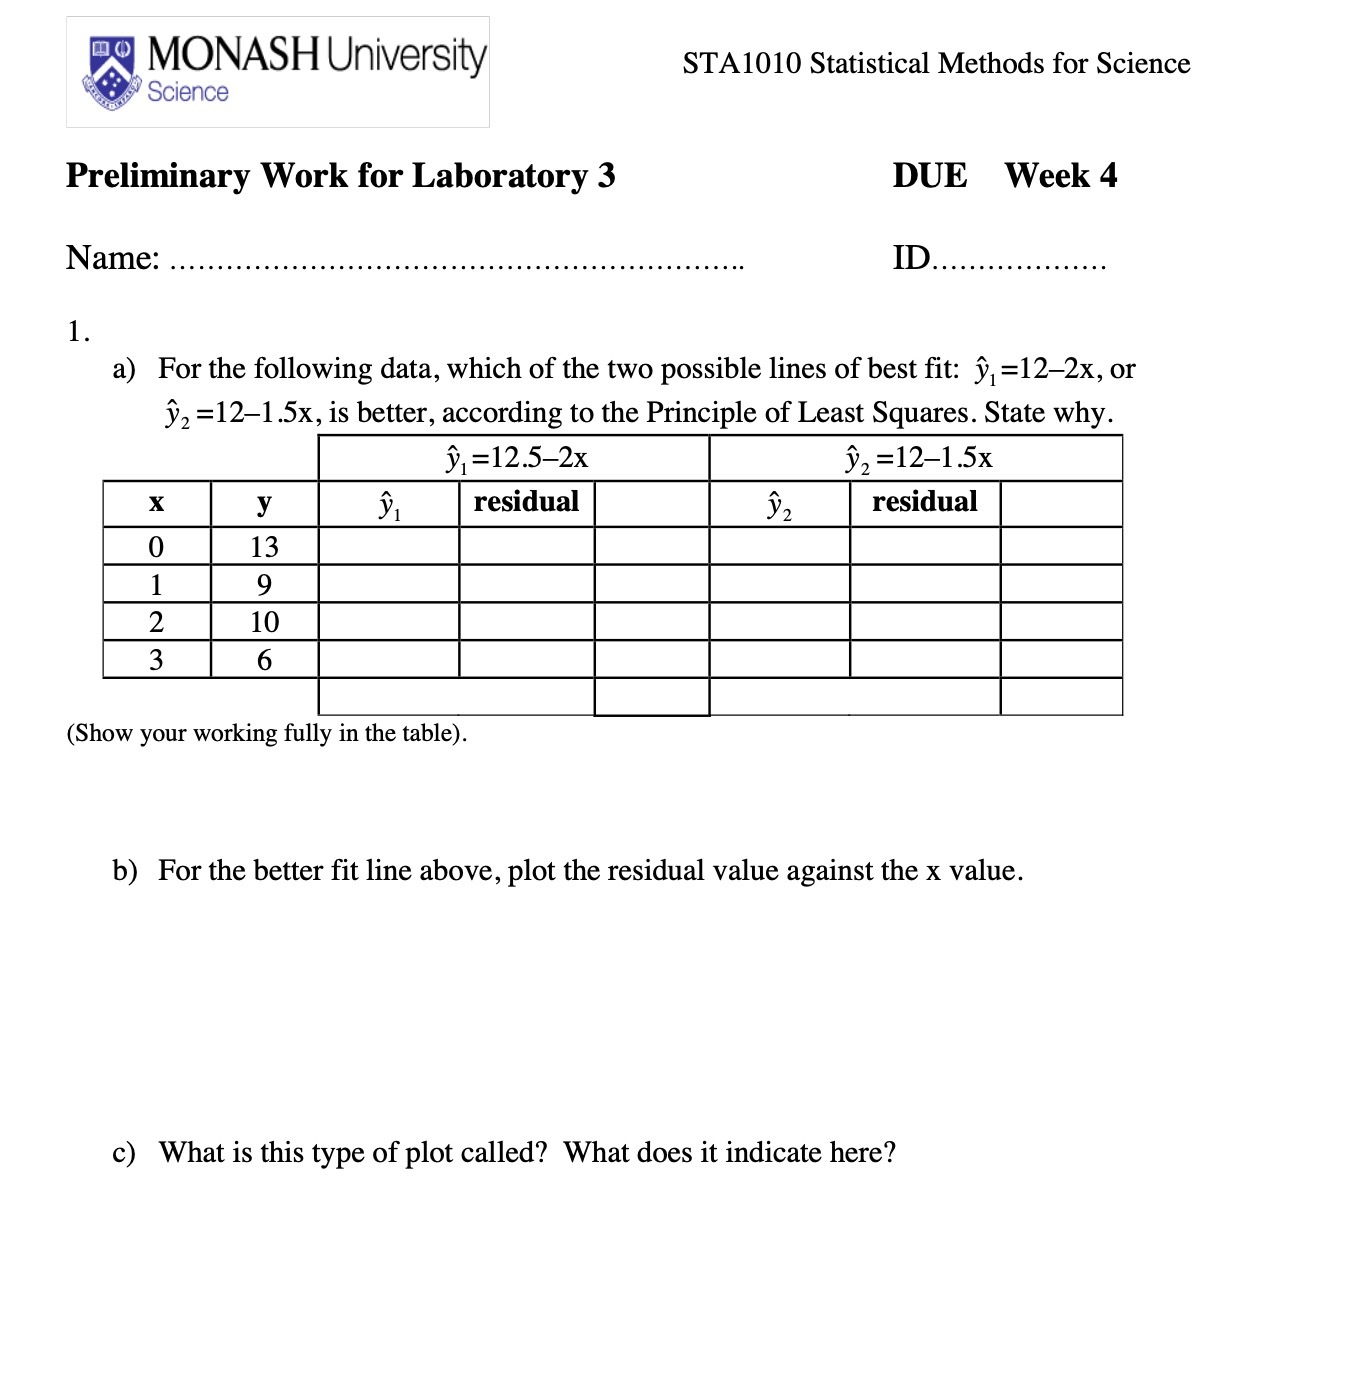
' MONASH University STA1010 Statistical Methods for Science all}? Science Preliminary Work for Laboratory 3 DUE Week 4 Name: .............................................................. 1D ................... 1. a) For the following data, which of the two possible lines of best t: 521212221, or 3'22 =121.5x, is better, according to the Principle of Least Squares. State why. {Show your working fully in the table). b) For the better fit line above, plot the residual value against the x value. c) What is this type of plot called? What does it indicate here
Step by Step Solution
There are 3 Steps involved in it
1 Expert Approved Answer
Step: 1 Unlock

Question Has Been Solved by an Expert!
Get step-by-step solutions from verified subject matter experts
Step: 2 Unlock
Step: 3 Unlock