

Question: Month Comp. Procedure 1 14 105 2 12 97 3 10 11 4 12 100 5 9 95 6 7 111 7 9 68 8
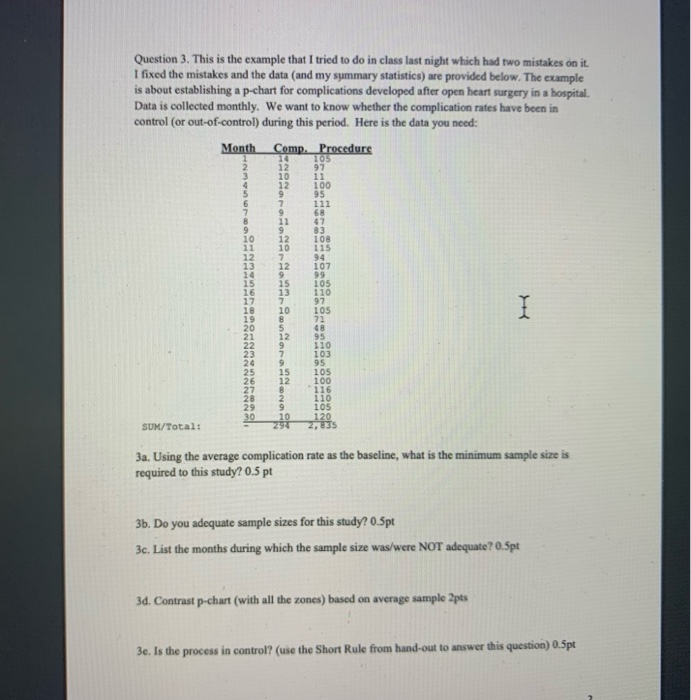
Question 3. This is the example that I tried to do in class last night which had two mistakes on it. I fixed the mistakes and the data (and my summary statistics) are provided below. The example is about establishing a p-chart for complications developed after open heart surgery in a hospital. Data is collected monthly. We want to know whether the complication rates have been in control (or out-of-control) during this period. Here is the data you need: Month Comp. Procedure 105 100 108 94 TODO UN PODOWN Caran SUM/Total: 3a. Using the average complication rate as the baseline, what is the minimum sample size is required to this study? 0.5 pt 3b. Do you adequate sample sizes for this study? 0.5pt 3c. List the months during which the sample size was/were NOT adequate? 0.5pt 3d. Contrast p-chart (with all the zones) based on average sample 2pts 3e. Is the process in control? (use the Short Rule from hand-out to answer this question) 0.5pt Question 3. This is the example that I tried to do in class last night which had two mistakes on it. I fixed the mistakes and the data (and my summary statistics) are provided below. The example is about establishing a p-chart for complications developed after open heart surgery in a hospital. Data is collected monthly. We want to know whether the complication rates have been in control (or out-of-control) during this period. Here is the data you need: Month Comp. Procedure 105 100 108 94 TODO UN PODOWN Caran SUM/Total: 3a. Using the average complication rate as the baseline, what is the minimum sample size is required to this study? 0.5 pt 3b. Do you adequate sample sizes for this study? 0.5pt 3c. List the months during which the sample size was/were NOT adequate? 0.5pt 3d. Contrast p-chart (with all the zones) based on average sample 2pts 3e. Is the process in control? (use the Short Rule from hand-out to answer this question) 0.5pt
Step by Step Solution
There are 3 Steps involved in it

Get step-by-step solutions from verified subject matter experts