

Question: Monthly excess return data are presented below for each of three stocks and the S&P index ( corrected for dividends ) for a 1 2
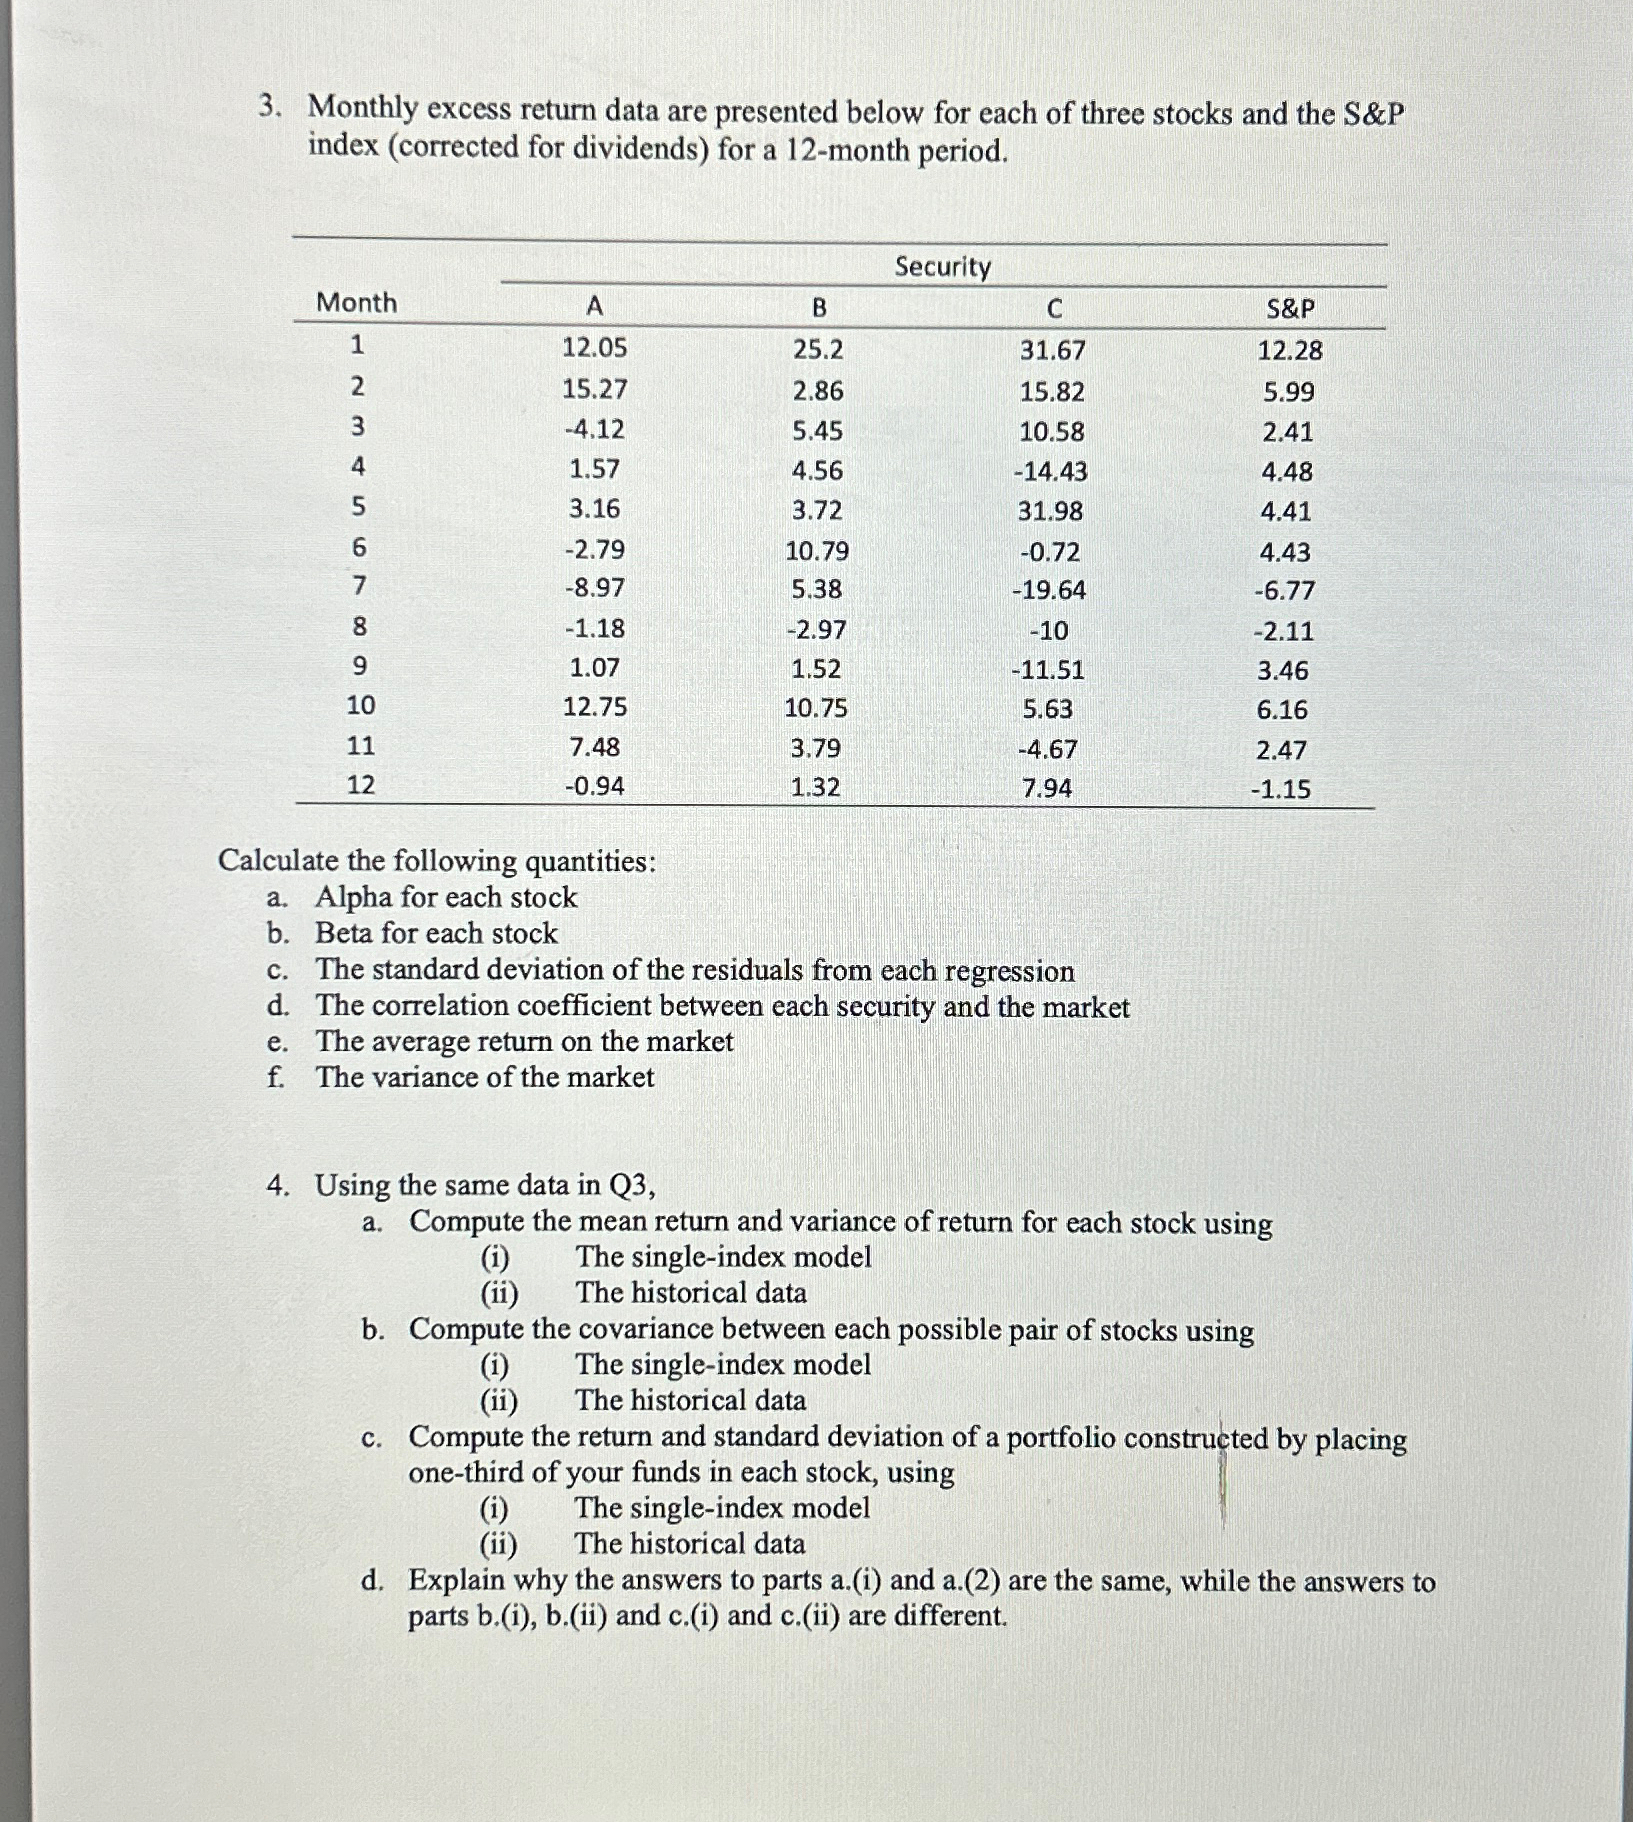
Monthly excess return data are presented below for each of three stocks and the S&P index corrected for dividends for a month period.
tableSecurityMonthABCS&P
Calculate the following quantities:
a Alpha for each stock
b Beta for each stock
c The standard deviation of the residuals from each regression
d The correlation coefficient between each security and the market
e The average return on the market
f The variance of the market
Using the same data in Q
a Compute the mean return and variance of return for each stock using
i The singleindex model
ii The historical data
b Compute the covariance between each possible pair of stocks using
i The singleindex model
ii The historical data
c Compute the return and standard deviation of a portfolio constructed by placing onethird of your funds in each stock, using
i The singleindex model
ii The historical data
d Explain why the answers to parts ai and a are the same, while the answers to parts bi bii and ci and cii are different.
Step by Step Solution
There are 3 Steps involved in it
1 Expert Approved Answer
Step: 1 Unlock

Question Has Been Solved by an Expert!
Get step-by-step solutions from verified subject matter experts
Step: 2 Unlock
Step: 3 Unlock