

Question: Monthly Return Data for a sample of companies drawn from the FTSE ALL SHARE that have traded continuously from January 2009 to December 2018. 4.
Monthly Return Data for a sample of companies drawn from the FTSE ALL SHARE that have traded continuously from January 2009 to December 2018.
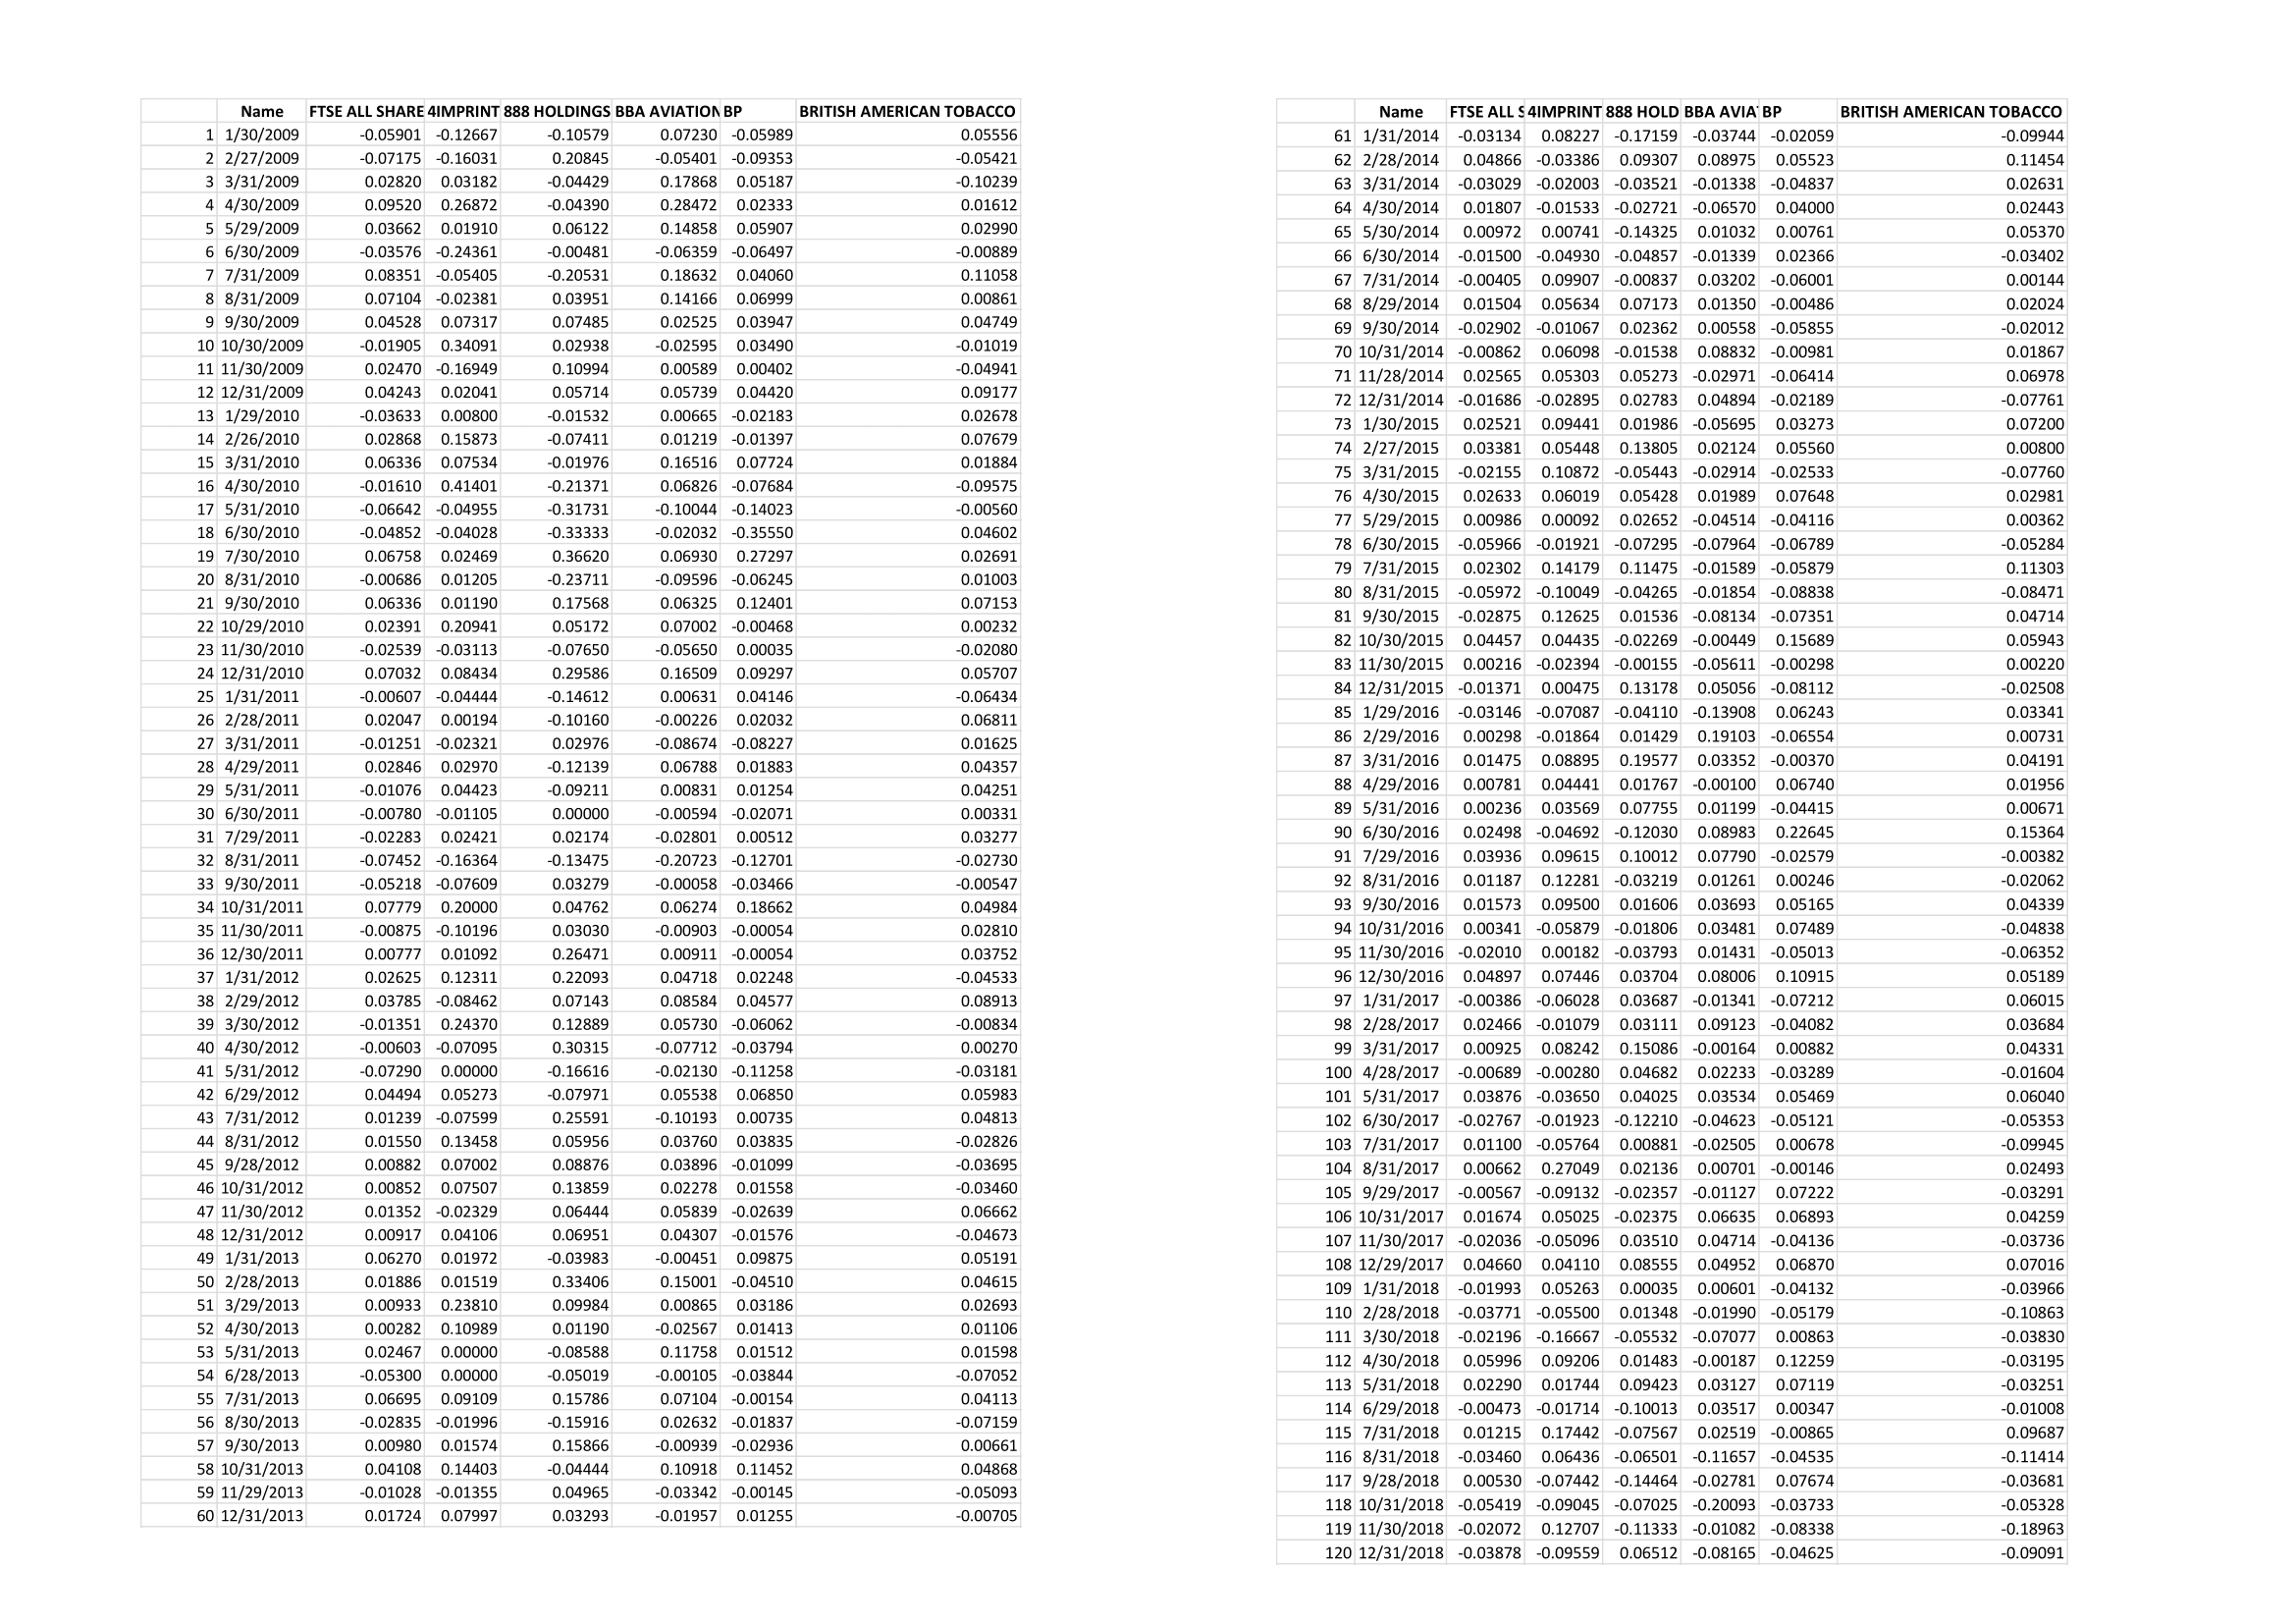
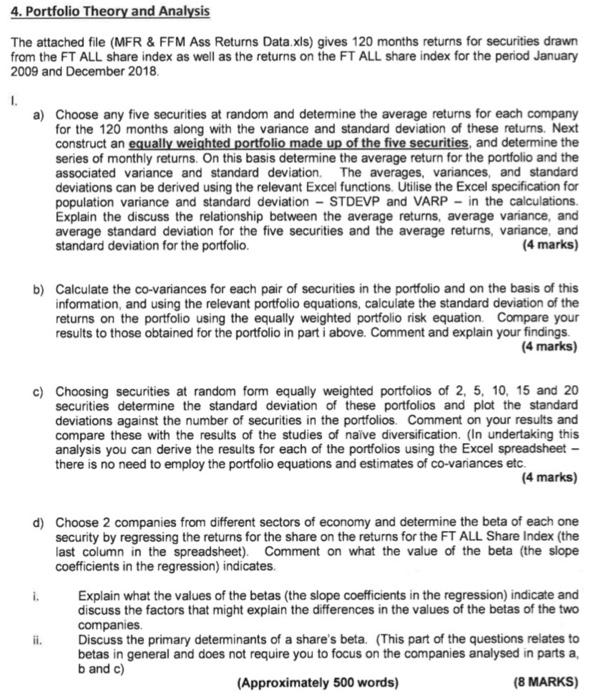
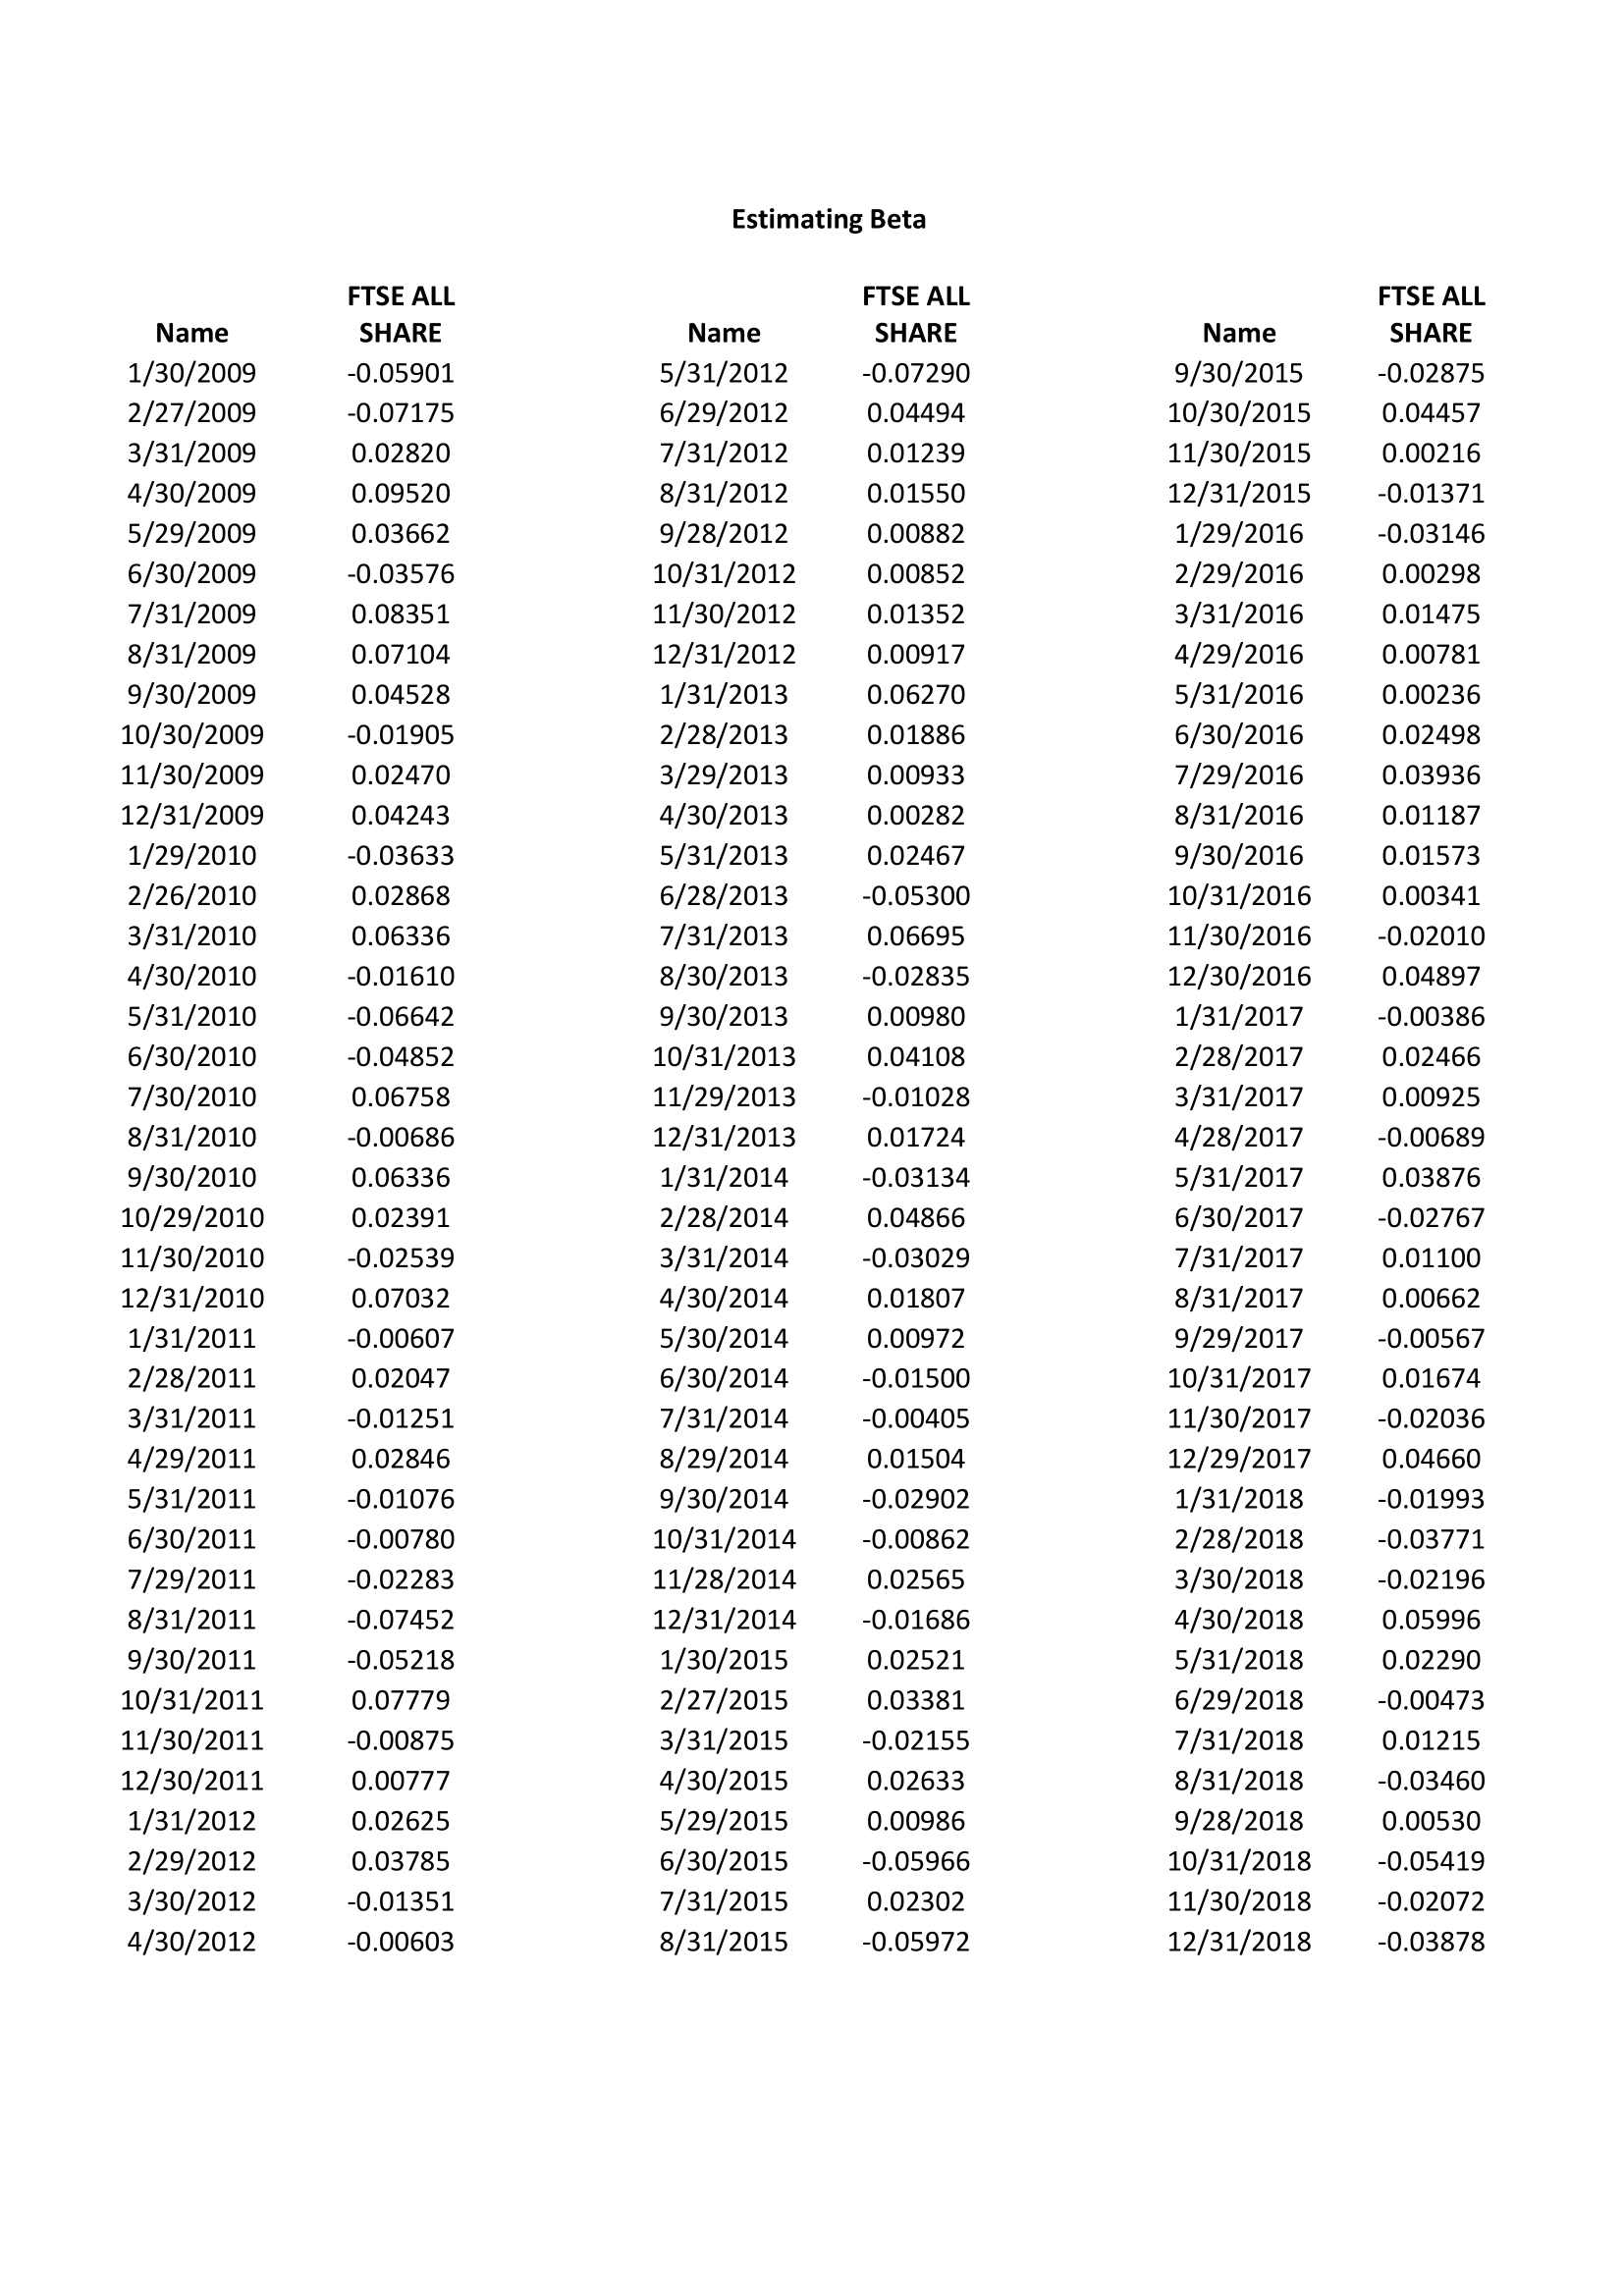
4. Portfolio Theory and Analysis The attached file (MER & FFM Ass Returns Data.xls) gives 120 months returns for securities drawn from the FT ALL share index as well as the returns on the FT ALL share index for the period January 2009 and December 2018 1. a) Choose any five securities at random and determine the average returns for each company for the 120 months along with the variance and standard deviation of these returns. Next construct an equally weighted portfolio made up of the five securities, and determine the series of monthly returns. On this basis determine the average return for the portfolio and the associated variance and standard deviation. The averages, variances, and standard deviations can be derived using the relevant Excel functions. Utilise the Excel specification for population variance and standard deviation - STDEVP and VARP - in the calculations. Explain the discuss the relationship between the average returns, average variance, and average standard deviation for the five securities and the average returns, variance, and standard deviation for the portfolio (4 marks) b) Calculate the co-variances for each pair of securities in the portfolio and on the basis of this information, and using the relevant portfolio equations, calculate the standard deviation of the returns on the portfolio using the equally weighted portfolio risk equation Compare your results to those obtained for the portfolio in part i above. Comment and explain your findings (4 marks) c) Choosing securities at random form equally weighted portfolios of 2, 5, 10, 15 and 20 securities determine the standard deviation of these portfolios and plot the standard deviations against the number of securities in the portfolios. Comment on your results and compare these with the results of the studies of nave diversification. (In undertaking this analysis you can derive the results for each of the portfolios using the Excel spreadsheet - there is no need to employ the portfolio equations and estimates of co-variances etc. (4 marks) d) Choose 2 companies from different sectors of economy and determine the beta of each one security by regressing the returns for the share on the returns for the FT ALL Share Index (the last column in the spreadsheet). Comment on what the value of the beta (the slope coefficients in the regression) indicates. i. Explain what the values of the betas (the slope coefficients in the regression) indicate and discuss the factors that might explain the differences in the values of the betas of the two companies ii. Discuss the primary determinants of a share's beta. (This part of the questions relates to betas in general and does not require you to focus on the companies analysed in parts a, b and c) (Approximately 500 words) (8 MARKS) Estimating Beta FTSE ALL FTSE ALL FTSE ALL SHARE SHARE -0.05901 -0.07290 -0.07175 0.04494 SHARE -0.02875 0.04457 0.00216 -0.01371 -0.03146 0.01239 0.01550 0.02820 0.09520 0.03662 -0.03576 0.00882 0.00852 0.00298 0.08351 0.01352 0.01475 0.07104 0.00917 0.00781 0.04528 0.06270 -0.01905 0.02470 0.01886 0.00933 0.00236 0.02498 0.03936 0.01187 0.01573 0.04243 0.00282 0.02467 -0.03633 0.02868 0.06336 -0.05300 0.06695 -0.02835 -0.01610 0.00341 -0.02010 0.04897 -0.00386 0.02466 -0.06642 0.00980 -0.04852 0.06758 0.00925 Name 1/30/2009 2/27/2009 3/31/2009 4/30/2009 5/29/2009 6/30/2009 7/31/2009 8/31/2009 9/30/2009 10/30/2009 11/30/2009 12/31/2009 1/29/2010 2/26/2010 3/31/2010 4/30/2010 5/31/2010 6/30/2010 7/30/2010 8/31/2010 9/30/2010 10/29/2010 11/30/2010 12/31/2010 1/31/2011 2/28/2011 3/31/2011 4/29/2011 5/31/2011 6/30/2011 7/29/2011 8/31/2011 9/30/2011 10/31/2011 11/30/2011 12/30/2011 1/31/2012 2/29/2012 3/30/2012 4/30/2012 -0.00686 Name 5/31/2012 6/29/2012 7/31/20 8/31/2012 9/28/2012 10/31/2012 11/30/2012 12/31/2012 1/31/2013 2/28/2013 3/29/2013 4/30/2013 5/31/2013 6/28/2013 7/31/2013 8/30/2013 9/30/2013 10/31/2013 11/29/2013 12/31/2013 1/31/2014 2/28/2014 3/31/2014 4/30/2014 5/30/2014 6/30/2014 7/31/2014 8/29/2014 9/30/2014 10/31/2014 11/28/2014 12/31/2014 1/30/2015 2/27/2015 3/31/2015 4/30/2015 5/29/2015 6/30/2015 7/31/2015 8/31/2015 0.04108 -0.01028 0.01724 -0.03134 0.04866 Name 9/30/2015 10/30/2015 11/30/2015 12/31/2015 1/29/2016 2/29/2016 3/31/2016 4/29/2016 5/31/2016 6/30/2016 7/29/2016 8/31/2016 9/30/2016 10/31/2016 11/30/2016 12/30/2016 1/31/2017 2/28/2017 3/31/2017 4/28/2017 5/31/2017 6/30/2017 7/31/2017 8/31/2017 9/29/2017 10/31/2017 11/30/2017 12/29/2017 1/31/2018 2/28/2018 3/30/2018 4/30/2018 5/31/2018 6/29/2018 7/31/2018 8/31/2018 9/28/2018 10/31/2018 11/30/2018 12/31/2018 -0.00689 0.06336 0.02391 0.03876 -0.02767 0.01100 -0.02539 -0.03029 0.07032 0.00662 -0.00607 0.02047 -0.01251 0.01807 0.00972 -0.01500 -0.00405 0.01504 -0.02902 -0.00862 -0.00567 0.01674 -0.02036 0.02846 0.04660 -0.01076 -0.01993 -0.03771 -0.00780 -0.02196 -0.02283 -0.07452 -0.05218 0.02565 -0.01686 0.02521 0.07779 0.03381 0.05996 0.02290 -0.00473 0.01215 -0.03460 -0.02155 -0.00875 0.00777 0.02625 0.02633 0.00986 0.00530 -0.05966 -0.05419 0.03785 -0.01351 0.02302 -0.05972 -0.02072 -0.03878 -0.00603 Name FTSE ALL SHARE 4IMPRINT 888 HOLDINGS BBA AVIATION BP BRITISH AMERICAN TOBACCO 1 1/30/2009 -0.05901 -0.12667 -0.10579 0.07230 -0.05989 0.05556 2 2/27/2009 -0.07175 -0.16031 0.20845 -0.05401 -0.09353 -0.05421 3 3/31/2009 0.02820 0.03182 -0.04429 0.17868 0.05187 -0.10239 4 4/30/2009 0.09520 0.26872 -0.04390 0.28472 0.02333 0.01612 5 5/29/2009 0.03662 0.01910 0.06122 0.14858 0.05907 0.02990 6 6/30/2009 -0.03576 -0.24361 -0.00481 -0.06359 -0.06497 -0.00889 7 7/31/2009 0.08351 -0.05405 -0.20531 0.18632 0.04060 0.11058 8 8/31/2009 0.07104 -0.02381 0.03951 0.14166 0.06999 0.00861 9 9/30/2009 0.04528 0.07317 0.07485 0.02525 0.03947 0.04749 10 10/30/2009 -0.01905 0.34091 0.02938 -0.02595 0.03490 -0.01019 11 11/30/2009 0.02470 -0.16949 0.10994 0.00589 0.00402 -0.04941 12 12/31/2009 0.04243 0.02041 0.05714 0.05739 0.04420 0.09177 13 1/29/2010 -0.03633 0.00800 -0.01532 0.00665 -0.02183 0.02678 14 2/26/2010 0.02868 0.15873 -0.07411 0.01219 -0.01397 0.07679 15 3/31/2010 0.06336 0.07534 -0.01976 0.16516 0.07724 0.01884 16 4/30/2010 -0.01610 0.41401 -0.21371 0.06826 -0.07684 -0.09575 17 5/31/2010 -0.06642 -0.04955 -0.31731 -0.10044 -0.14023 -0.00560 18 6/30/2010 -0.04852 -0.04028 -0.33333 -0.02032 -0.35550 0.04602 19 7/30/2010 0.06758 0.02469 0.36620 0.06930 0.27297 0.02691 20 8/31/2010 -0.00686 0.01205 -0.23711 -0.09596 -0.06245 0.01003 21 9/30/2010 0.06336 0.01190 0.17568 0.06325 0.12401 0.07153 22 10/29/2010 0.02391 0.20941 0.05172 0.07002 -0.00468 0.00232 23 11/30/2010 -0.02539 -0.03113 -0.07650 -0.05650 0.00035 -0.02080 24 12/31/2010 0.07032 0.08434 0.29586 0.16509 0.09297 0.05707 25 1/31/2011 -0.00607 -0.04444 -0.14612 0.00631 0.04146 -0.06434 26 2/28/2011 0.02047 0.00194 -0.10160 -0.00226 0.02032 0.06811 27 3/31/2011 -0.01251 -0.02321 0.02976 -0.08674 -0.08227 0.01625 28 4/29/2011 0.02846 0.02970 -0.12139 0.06788 0.01883 0.04357 29 5/31/2011 -0.01076 0.04423 -0.09211 0.00831 0.01254 0.04251 30 6/30/2011 -0.00780 -0.01105 0.00000 -0.00594 -0.02071 0.00331 31 7/29/2011 -0.02283 0.02421 0.02174 -0.02801 0.00512 0.03277 32 8/31/2011 -0.07452 -0.16364 -0.13475 -0.20723 -0.12701 -0.02730 33 9/30/2011 -0.05218 -0.07609 0.03279 -0.00058 -0.03466 -0.00547 34 10/31/2011 0.07779 0.20000 0.04762 0.06274 0.18662 0.04984 35 11/30/2011 -0.00875 -0.10196 0.03030 -0.00903 -0.00054 0.02810 36 12/30/2011 0.00777 0.01092 0.26471 0.00911 -0.00054 0.03752 37 1/31/2012 0.02625 0.12311 0.22093 0.04718 0.02248 -0.04533 38 2/29/2012 0.03785 -0.08462 0.07143 0.08584 0.04577 0.08913 39 3/30/2012 -0.01351 0.24370 0.12889 0.05730 -0.06062 -0.00834 40 4/30/2012 -0.00603 -0.07095 0.30315 -0.07712 -0.03794 0.00270 41 5/31/2012 -0.07290 0.00000 -0.16616 -0.02130 -0.11258 -0.03181 42 6/29/2012 0.04494 0.05273 -0.07971 0.05538 0.06850 0.05983 43 7/31/2012 0.01239 -0.07599 0.25591 -0.10193 0.00735 0.04813 44 8/31/2012 0.01550 0.13458 0.05956 0.03760 0.03835 -0.02826 45 9/28/2012 0.00882 0.07002 0.08876 0.03896 -0.01099 -0.03695 46 10/31/2012 0.00852 0.07507 0.13859 0.02278 0.01558 -0.03460 47 11/30/2012 0.01352 -0.02329 0.06444 0.05839 -0.02639 0.06662 48 12/31/2012 0.00917 0.04106 0.06951 0.04307 -0.01576 -0.04673 49 1/31/2013 0.06270 0.01972 -0.03983 -0.00451 0.09875 0.05191 50 2/28/2013 0.01886 0.01519 0.33406 0.15001 -0.04510 0.04615 51 3/29/2013 0.00933 0.23810 0.09984 0.00865 0.03186 0.02693 52 4/30/2013 0.00282 0.10989 0.01190 -0.02567 0.01413 0.01106 53 5/31/2013 0.02467 0.00000 -0.08588 0.11758 0.01512 0.01598 54 6/28/2013 -0.05300 0.00000 -0.05019 -0.00105 -0.03844 -0.07052 55 7/31/2013 0.06695 0.09109 0.15786 0.07104 -0.00154 0.04113 56 8/30/2013 -0.02835 -0.01996 -0.15916 0.02632 -0.01837 -0.07159 57 9/30/2013 0.00980 0.01574 0.15866 -0.00939 -0.02936 0.00661 58 10/31/2013 0.04108 0.14403 -0.04444 0.10918 0.11452 0.04868 59 11/29/2013 -0.01028 -0.01355 0.04965 -0.03342 -0.00145 -0.05093 60 12/31/2013 0.01724 0.07997 0.03293 -0.01957 0.01255 -0.00705 Name FTSE ALL S 4IMPRINT 888 HOLD BBA AVIA BP BRITISH AMERICAN TOBACCO 61 1/31/2014 -0.03134 0.08227 -0.17159 -0.03744 -0.02059 -0.09944 62 2/28/2014 0.04866 -0.03386 0.09307 0.08975 0.05523 0.11454 63 3/31/2014 -0.03029 -0.02003 -0.03521 -0.01338 -0.04837 0.02631 64 4/30/2014 0.01807 -0.01533 -0.02721 -0.06570 0.04000 0.02443 65 5/30/2014 0.00972 0.00741 -0.14325 0.01032 0.00761 0.05370 66 6/30/2014 -0.01500 -0.04930 -0.04857 -0.01339 0.02366 -0.03402 67 7/31/2014 -0.00405 0.09907 -0.00837 0.03202 -0.06001 0.00144 68 8/29/2014 0.01504 0.05634 0.07173 0.01350 -0.00486 0.02024 69 9/30/2014 -0.02902 -0.01067 0.02362 0.00558 -0.05855 -0.02012 70 10/31/2014 -0.00862 0.06098 -0.01538 0.08832 -0.00981 0.01867 71 11/28/2014 0.02565 0.05303 0.05273 -0.02971 -0.06414 0.06978 72 12/31/2014 -0.01686 -0.02895 0.02783 0.04894 -0.02189 -0.07761 73 1/30/2015 0.02521 0.09441 0.01986 -0.05695 0.03273 0.07200 74 2/27/2015 0.03381 0.05448 0.13805 0.02124 0.05560 0.00800 75 3/31/2015 -0.02155 0.10872 -0.05443 -0.02914 -0.02533 -0.07760 76 4/30/2015 0.02633 0.06019 0.05428 0.01989 0.07648 0.02981 77 5/29/2015 0.00986 0.00092 0.02652 -0.04514 -0.04116 0.00362 78 6/30/2015 -0.05966 -0.01921 -0.07295 -0.07964 -0.06789 -0.05284 79 7/31/2015 0.02302 0.14179 0.11475 -0.01589 -0.05879 0.11303 80 8/31/2015 -0.05972 -0.10049 -0.04265 -0.01854 -0.08838 -0.08471 81 9/30/2015 -0.02875 0.12625 0.01536 -0.08134 -0.07351 0.04714 82 10/30/2015 0.04457 0.04435 -0.02269 -0.00449 0.15689 0.05943 83 11/30/2015 0.00216 -0.02394 -0.00155 -0.05611 -0.00298 0.00220 84 12/31/2015 -0.01371 0.00475 0.13178 0.05056 -0.08112 -0.02508 85 1/29/2016 -0.03146 -0.07087 -0.04110 -0.13908 0.06243 0.03341 86 2/29/2016 0.00298 -0.01864 0.01429 0.19103 -0.06554 0.00731 87 3/31/2016 0.01475 0.08895 0.19577 0.03352 -0.00370 0.04191 88 4/29/2016 0.00781 0.04441 0.01767 -0.00100 0.06740 0.01956 89 5/31/2016 0.00236 0.03569 0.07755 0.01199 -0.04415 0.00671 90 6/30/2016 0.02498 -0.04692 -0.12030 0.08983 0.22645 0.15364 91 7/29/2016 0.03936 0.09615 0.10012 0.07790 -0.02579 -0.00382 92 8/31/2016 0.01187 0.12281 -0.03219 0.01261 0.00246 -0.02062 93 9/30/2016 0.01573 0.09500 0.01606 0.03693 0.05165 0.04339 94 10/31/2016 0.00341 -0.05879 -0.01806 0.03481 0.07489 -0.04838 95 11/30/2016 -0.02010 0.00182 -0.03793 0.01431 -0.05013 -0.06352 96 12/30/2016 0.04897 0.07446 0.03704 0.08006 0.10915 0.05189 97 1/31/2017 -0.00386 -0.06028 0.03687 -0.01341 -0.07212 0.06015 98 2/28/2017 0.02466 -0.01079 0.03111 0.09123 -0.04082 0.03684 99 3/31/2017 0.00925 0.08242 0.15086 -0.00164 0.00882 0.04331 100 4/28/2017 -0.00689 -0.00280 0.04682 0.02233 -0.03289 -0.01604 101 5/31/2017 0.03876 -0.03650 0.04025 0.03534 0.05469 0.06040 102 6/30/2017 -0.02767 -0.01923 -0.12210 -0.04623 -0.05121 -0.05353 103 7/31/2017 0.01100 -0.05764 0.00881 -0.02505 0.00678 -0.09945 104 8/31/2017 0.00662 0.27049 0.02136 0.00701 -0.00146 0.02493 105 9/29/2017 -0.00567 -0.09132 -0.02357 -0.01127 0.07222 -0.03291 106 10/31/2017 0.01674 0.05025 -0.02375 0.06635 0.06893 0.04259 107 11/30/2017 -0.02036 -0.05096 0.03510 0.04714 -0.04136 -0.03736 108 12/29/2017 0.04660 0.04110 0.08555 0.04952 0.06870 0.07016 109 1/31/2018 -0.01993 0.05263 0.00035 0.00601 -0.04132 -0.03966 110 2/28/2018 -0.03771 -0.05500 0.01348 -0.01990 -0.05179 -0.10863 111 3/30/2018 -0.02196 -0.16667 -0.05532 -0.07077 0.00863 -0.03830 112 4/30/2018 0.05996 0.09206 0.01483 -0.00187 0.12259 -0.03195 113 5/31/2018 0.02290 0.01744 0.09423 0.03127 0.07119 -0.03251 114 6/29/2018 -0.00473 -0.01714 -0.10013 0.03517 0.00347 -0.01008 115 7/31/2018 0.01215 0.17442 -0.07567 0.02519 -0.00865 0.09687 116 8/31/2018 -0.03460 0.06436 -0.06501 -0.11657 -0.04535 -0.11414 117 9/28/2018 0.00530 -0.07442 -0.14464 -0.02781 0.07674 -0.03681 118 10/31/2018 -0.05419 -0.09045 -0.07025 -0.20093 -0.03733 -0.05328 119 11/30/2018 -0.02072 0.12707 -0.11333 -0.01082 -0.08338 -0.18963 120 12/31/2018 -0.03878 -0.09559 0.06512 -0.08165 -0.04625 -0.09091 4. Portfolio Theory and Analysis The attached file (MER & FFM Ass Returns Data.xls) gives 120 months returns for securities drawn from the FT ALL share index as well as the returns on the FT ALL share index for the period January 2009 and December 2018 1. a) Choose any five securities at random and determine the average returns for each company for the 120 months along with the variance and standard deviation of these returns. Next construct an equally weighted portfolio made up of the five securities, and determine the series of monthly returns. On this basis determine the average return for the portfolio and the associated variance and standard deviation. The averages, variances, and standard deviations can be derived using the relevant Excel functions. Utilise the Excel specification for population variance and standard deviation - STDEVP and VARP - in the calculations. Explain the discuss the relationship between the average returns, average variance, and average standard deviation for the five securities and the average returns, variance, and standard deviation for the portfolio (4 marks) b) Calculate the co-variances for each pair of securities in the portfolio and on the basis of this information, and using the relevant portfolio equations, calculate the standard deviation of the returns on the portfolio using the equally weighted portfolio risk equation Compare your results to those obtained for the portfolio in part i above. Comment and explain your findings (4 marks) c) Choosing securities at random form equally weighted portfolios of 2, 5, 10, 15 and 20 securities determine the standard deviation of these portfolios and plot the standard deviations against the number of securities in the portfolios. Comment on your results and compare these with the results of the studies of nave diversification. (In undertaking this analysis you can derive the results for each of the portfolios using the Excel spreadsheet - there is no need to employ the portfolio equations and estimates of co-variances etc. (4 marks) d) Choose 2 companies from different sectors of economy and determine the beta of each one security by regressing the returns for the share on the returns for the FT ALL Share Index (the last column in the spreadsheet). Comment on what the value of the beta (the slope coefficients in the regression) indicates. i. Explain what the values of the betas (the slope coefficients in the regression) indicate and discuss the factors that might explain the differences in the values of the betas of the two companies ii. Discuss the primary determinants of a share's beta. (This part of the questions relates to betas in general and does not require you to focus on the companies analysed in parts a, b and c) (Approximately 500 words) (8 MARKS) Estimating Beta FTSE ALL FTSE ALL FTSE ALL SHARE SHARE -0.05901 -0.07290 -0.07175 0.04494 SHARE -0.02875 0.04457 0.00216 -0.01371 -0.03146 0.01239 0.01550 0.02820 0.09520 0.03662 -0.03576 0.00882 0.00852 0.00298 0.08351 0.01352 0.01475 0.07104 0.00917 0.00781 0.04528 0.06270 -0.01905 0.02470 0.01886 0.00933 0.00236 0.02498 0.03936 0.01187 0.01573 0.04243 0.00282 0.02467 -0.03633 0.02868 0.06336 -0.05300 0.06695 -0.02835 -0.01610 0.00341 -0.02010 0.04897 -0.00386 0.02466 -0.06642 0.00980 -0.04852 0.06758 0.00925 Name 1/30/2009 2/27/2009 3/31/2009 4/30/2009 5/29/2009 6/30/2009 7/31/2009 8/31/2009 9/30/2009 10/30/2009 11/30/2009 12/31/2009 1/29/2010 2/26/2010 3/31/2010 4/30/2010 5/31/2010 6/30/2010 7/30/2010 8/31/2010 9/30/2010 10/29/2010 11/30/2010 12/31/2010 1/31/2011 2/28/2011 3/31/2011 4/29/2011 5/31/2011 6/30/2011 7/29/2011 8/31/2011 9/30/2011 10/31/2011 11/30/2011 12/30/2011 1/31/2012 2/29/2012 3/30/2012 4/30/2012 -0.00686 Name 5/31/2012 6/29/2012 7/31/20 8/31/2012 9/28/2012 10/31/2012 11/30/2012 12/31/2012 1/31/2013 2/28/2013 3/29/2013 4/30/2013 5/31/2013 6/28/2013 7/31/2013 8/30/2013 9/30/2013 10/31/2013 11/29/2013 12/31/2013 1/31/2014 2/28/2014 3/31/2014 4/30/2014 5/30/2014 6/30/2014 7/31/2014 8/29/2014 9/30/2014 10/31/2014 11/28/2014 12/31/2014 1/30/2015 2/27/2015 3/31/2015 4/30/2015 5/29/2015 6/30/2015 7/31/2015 8/31/2015 0.04108 -0.01028 0.01724 -0.03134 0.04866 Name 9/30/2015 10/30/2015 11/30/2015 12/31/2015 1/29/2016 2/29/2016 3/31/2016 4/29/2016 5/31/2016 6/30/2016 7/29/2016 8/31/2016 9/30/2016 10/31/2016 11/30/2016 12/30/2016 1/31/2017 2/28/2017 3/31/2017 4/28/2017 5/31/2017 6/30/2017 7/31/2017 8/31/2017 9/29/2017 10/31/2017 11/30/2017 12/29/2017 1/31/2018 2/28/2018 3/30/2018 4/30/2018 5/31/2018 6/29/2018 7/31/2018 8/31/2018 9/28/2018 10/31/2018 11/30/2018 12/31/2018 -0.00689 0.06336 0.02391 0.03876 -0.02767 0.01100 -0.02539 -0.03029 0.07032 0.00662 -0.00607 0.02047 -0.01251 0.01807 0.00972 -0.01500 -0.00405 0.01504 -0.02902 -0.00862 -0.00567 0.01674 -0.02036 0.02846 0.04660 -0.01076 -0.01993 -0.03771 -0.00780 -0.02196 -0.02283 -0.07452 -0.05218 0.02565 -0.01686 0.02521 0.07779 0.03381 0.05996 0.02290 -0.00473 0.01215 -0.03460 -0.02155 -0.00875 0.00777 0.02625 0.02633 0.00986 0.00530 -0.05966 -0.05419 0.03785 -0.01351 0.02302 -0.05972 -0.02072 -0.03878 -0.00603 Name FTSE ALL SHARE 4IMPRINT 888 HOLDINGS BBA AVIATION BP BRITISH AMERICAN TOBACCO 1 1/30/2009 -0.05901 -0.12667 -0.10579 0.07230 -0.05989 0.05556 2 2/27/2009 -0.07175 -0.16031 0.20845 -0.05401 -0.09353 -0.05421 3 3/31/2009 0.02820 0.03182 -0.04429 0.17868 0.05187 -0.10239 4 4/30/2009 0.09520 0.26872 -0.04390 0.28472 0.02333 0.01612 5 5/29/2009 0.03662 0.01910 0.06122 0.14858 0.05907 0.02990 6 6/30/2009 -0.03576 -0.24361 -0.00481 -0.06359 -0.06497 -0.00889 7 7/31/2009 0.08351 -0.05405 -0.20531 0.18632 0.04060 0.11058 8 8/31/2009 0.07104 -0.02381 0.03951 0.14166 0.06999 0.00861 9 9/30/2009 0.04528 0.07317 0.07485 0.02525 0.03947 0.04749 10 10/30/2009 -0.01905 0.34091 0.02938 -0.02595 0.03490 -0.01019 11 11/30/2009 0.02470 -0.16949 0.10994 0.00589 0.00402 -0.04941 12 12/31/2009 0.04243 0.02041 0.05714 0.05739 0.04420 0.09177 13 1/29/2010 -0.03633 0.00800 -0.01532 0.00665 -0.02183 0.02678 14 2/26/2010 0.02868 0.15873 -0.07411 0.01219 -0.01397 0.07679 15 3/31/2010 0.06336 0.07534 -0.01976 0.16516 0.07724 0.01884 16 4/30/2010 -0.01610 0.41401 -0.21371 0.06826 -0.07684 -0.09575 17 5/31/2010 -0.06642 -0.04955 -0.31731 -0.10044 -0.14023 -0.00560 18 6/30/2010 -0.04852 -0.04028 -0.33333 -0.02032 -0.35550 0.04602 19 7/30/2010 0.06758 0.02469 0.36620 0.06930 0.27297 0.02691 20 8/31/2010 -0.00686 0.01205 -0.23711 -0.09596 -0.06245 0.01003 21 9/30/2010 0.06336 0.01190 0.17568 0.06325 0.12401 0.07153 22 10/29/2010 0.02391 0.20941 0.05172 0.07002 -0.00468 0.00232 23 11/30/2010 -0.02539 -0.03113 -0.07650 -0.05650 0.00035 -0.02080 24 12/31/2010 0.07032 0.08434 0.29586 0.16509 0.09297 0.05707 25 1/31/2011 -0.00607 -0.04444 -0.14612 0.00631 0.04146 -0.06434 26 2/28/2011 0.02047 0.00194 -0.10160 -0.00226 0.02032 0.06811 27 3/31/2011 -0.01251 -0.02321 0.02976 -0.08674 -0.08227 0.01625 28 4/29/2011 0.02846 0.02970 -0.12139 0.06788 0.01883 0.04357 29 5/31/2011 -0.01076 0.04423 -0.09211 0.00831 0.01254 0.04251 30 6/30/2011 -0.00780 -0.01105 0.00000 -0.00594 -0.02071 0.00331 31 7/29/2011 -0.02283 0.02421 0.02174 -0.02801 0.00512 0.03277 32 8/31/2011 -0.07452 -0.16364 -0.13475 -0.20723 -0.12701 -0.02730 33 9/30/2011 -0.05218 -0.07609 0.03279 -0.00058 -0.03466 -0.00547 34 10/31/2011 0.07779 0.20000 0.04762 0.06274 0.18662 0.04984 35 11/30/2011 -0.00875 -0.10196 0.03030 -0.00903 -0.00054 0.02810 36 12/30/2011 0.00777 0.01092 0.26471 0.00911 -0.00054 0.03752 37 1/31/2012 0.02625 0.12311 0.22093 0.04718 0.02248 -0.04533 38 2/29/2012 0.03785 -0.08462 0.07143 0.08584 0.04577 0.08913 39 3/30/2012 -0.01351 0.24370 0.12889 0.05730 -0.06062 -0.00834 40 4/30/2012 -0.00603 -0.07095 0.30315 -0.07712 -0.03794 0.00270 41 5/31/2012 -0.07290 0.00000 -0.16616 -0.02130 -0.11258 -0.03181 42 6/29/2012 0.04494 0.05273 -0.07971 0.05538 0.06850 0.05983 43 7/31/2012 0.01239 -0.07599 0.25591 -0.10193 0.00735 0.04813 44 8/31/2012 0.01550 0.13458 0.05956 0.03760 0.03835 -0.02826 45 9/28/2012 0.00882 0.07002 0.08876 0.03896 -0.01099 -0.03695 46 10/31/2012 0.00852 0.07507 0.13859 0.02278 0.01558 -0.03460 47 11/30/2012 0.01352 -0.02329 0.06444 0.05839 -0.02639 0.06662 48 12/31/2012 0.00917 0.04106 0.06951 0.04307 -0.01576 -0.04673 49 1/31/2013 0.06270 0.01972 -0.03983 -0.00451 0.09875 0.05191 50 2/28/2013 0.01886 0.01519 0.33406 0.15001 -0.04510 0.04615 51 3/29/2013 0.00933 0.23810 0.09984 0.00865 0.03186 0.02693 52 4/30/2013 0.00282 0.10989 0.01190 -0.02567 0.01413 0.01106 53 5/31/2013 0.02467 0.00000 -0.08588 0.11758 0.01512 0.01598 54 6/28/2013 -0.05300 0.00000 -0.05019 -0.00105 -0.03844 -0.07052 55 7/31/2013 0.06695 0.09109 0.15786 0.07104 -0.00154 0.04113 56 8/30/2013 -0.02835 -0.01996 -0.15916 0.02632 -0.01837 -0.07159 57 9/30/2013 0.00980 0.01574 0.15866 -0.00939 -0.02936 0.00661 58 10/31/2013 0.04108 0.14403 -0.04444 0.10918 0.11452 0.04868 59 11/29/2013 -0.01028 -0.01355 0.04965 -0.03342 -0.00145 -0.05093 60 12/31/2013 0.01724 0.07997 0.03293 -0.01957 0.01255 -0.00705 Name FTSE ALL S 4IMPRINT 888 HOLD BBA AVIA BP BRITISH AMERICAN TOBACCO 61 1/31/2014 -0.03134 0.08227 -0.17159 -0.03744 -0.02059 -0.09944 62 2/28/2014 0.04866 -0.03386 0.09307 0.08975 0.05523 0.11454 63 3/31/2014 -0.03029 -0.02003 -0.03521 -0.01338 -0.04837 0.02631 64 4/30/2014 0.01807 -0.01533 -0.02721 -0.06570 0.04000 0.02443 65 5/30/2014 0.00972 0.00741 -0.14325 0.01032 0.00761 0.05370 66 6/30/2014 -0.01500 -0.04930 -0.04857 -0.01339 0.02366 -0.03402 67 7/31/2014 -0.00405 0.09907 -0.00837 0.03202 -0.06001 0.00144 68 8/29/2014 0.01504 0.05634 0.07173 0.01350 -0.00486 0.02024 69 9/30/2014 -0.02902 -0.01067 0.02362 0.00558 -0.05855 -0.02012 70 10/31/2014 -0.00862 0.06098 -0.01538 0.08832 -0.00981 0.01867 71 11/28/2014 0.02565 0.05303 0.05273 -0.02971 -0.06414 0.06978 72 12/31/2014 -0.01686 -0.02895 0.02783 0.04894 -0.02189 -0.07761 73 1/30/2015 0.02521 0.09441 0.01986 -0.05695 0.03273 0.07200 74 2/27/2015 0.03381 0.05448 0.13805 0.02124 0.05560 0.00800 75 3/31/2015 -0.02155 0.10872 -0.05443 -0.02914 -0.02533 -0.07760 76 4/30/2015 0.02633 0.06019 0.05428 0.01989 0.07648 0.02981 77 5/29/2015 0.00986 0.00092 0.02652 -0.04514 -0.04116 0.00362 78 6/30/2015 -0.05966 -0.01921 -0.07295 -0.07964 -0.06789 -0.05284 79 7/31/2015 0.02302 0.14179 0.11475 -0.01589 -0.05879 0.11303 80 8/31/2015 -0.05972 -0.10049 -0.04265 -0.01854 -0.08838 -0.08471 81 9/30/2015 -0.02875 0.12625 0.01536 -0.08134 -0.07351 0.04714 82 10/30/2015 0.04457 0.04435 -0.02269 -0.00449 0.15689 0.05943 83 11/30/2015 0.00216 -0.02394 -0.00155 -0.05611 -0.00298 0.00220 84 12/31/2015 -0.01371 0.00475 0.13178 0.05056 -0.08112 -0.02508 85 1/29/2016 -0.03146 -0.07087 -0.04110 -0.13908 0.06243 0.03341 86 2/29/2016 0.00298 -0.01864 0.01429 0.19103 -0.06554 0.00731 87 3/31/2016 0.01475 0.08895 0.19577 0.03352 -0.00370 0.04191 88 4/29/2016 0.00781 0.04441 0.01767 -0.00100 0.06740 0.01956 89 5/31/2016 0.00236 0.03569 0.07755 0.01199 -0.04415 0.00671 90 6/30/2016 0.02498 -0.04692 -0.12030 0.08983 0.22645 0.15364 91 7/29/2016 0.03936 0.09615 0.10012 0.07790 -0.02579 -0.00382 92 8/31/2016 0.01187 0.12281 -0.03219 0.01261 0.00246 -0.02062 93 9/30/2016 0.01573 0.09500 0.01606 0.03693 0.05165 0.04339 94 10/31/2016 0.00341 -0.05879 -0.01806 0.03481 0.07489 -0.04838 95 11/30/2016 -0.02010 0.00182 -0.03793 0.01431 -0.05013 -0.06352 96 12/30/2016 0.04897 0.07446 0.03704 0.08006 0.10915 0.05189 97 1/31/2017 -0.00386 -0.06028 0.03687 -0.01341 -0.07212 0.06015 98 2/28/2017 0.02466 -0.01079 0.03111 0.09123 -0.04082 0.03684 99 3/31/2017 0.00925 0.08242 0.15086 -0.00164 0.00882 0.04331 100 4/28/2017 -0.00689 -0.00280 0.04682 0.02233 -0.03289 -0.01604 101 5/31/2017 0.03876 -0.03650 0.04025 0.03534 0.05469 0.06040 102 6/30/2017 -0.02767 -0.01923 -0.12210 -0.04623 -0.05121 -0.05353 103 7/31/2017 0.01100 -0.05764 0.00881 -0.02505 0.00678 -0.09945 104 8/31/2017 0.00662 0.27049 0.02136 0.00701 -0.00146 0.02493 105 9/29/2017 -0.00567 -0.09132 -0.02357 -0.01127 0.07222 -0.03291 106 10/31/2017 0.01674 0.05025 -0.02375 0.06635 0.06893 0.04259 107 11/30/2017 -0.02036 -0.05096 0.03510 0.04714 -0.04136 -0.03736 108 12/29/2017 0.04660 0.04110 0.08555 0.04952 0.06870 0.07016 109 1/31/2018 -0.01993 0.05263 0.00035 0.00601 -0.04132 -0.03966 110 2/28/2018 -0.03771 -0.05500 0.01348 -0.01990 -0.05179 -0.10863 111 3/30/2018 -0.02196 -0.16667 -0.05532 -0.07077 0.00863 -0.03830 112 4/30/2018 0.05996 0.09206 0.01483 -0.00187 0.12259 -0.03195 113 5/31/2018 0.02290 0.01744 0.09423 0.03127 0.07119 -0.03251 114 6/29/2018 -0.00473 -0.01714 -0.10013 0.03517 0.00347 -0.01008 115 7/31/2018 0.01215 0.17442 -0.07567 0.02519 -0.00865 0.09687 116 8/31/2018 -0.03460 0.06436 -0.06501 -0.11657 -0.04535 -0.11414 117 9/28/2018 0.00530 -0.07442 -0.14464 -0.02781 0.07674 -0.03681 118 10/31/2018 -0.05419 -0.09045 -0.07025 -0.20093 -0.03733 -0.05328 119 11/30/2018 -0.02072 0.12707 -0.11333 -0.01082 -0.08338 -0.18963 120 12/31/2018 -0.03878 -0.09559 0.06512 -0.08165 -0.04625 -0.09091
Step by Step Solution
There are 3 Steps involved in it

Get step-by-step solutions from verified subject matter experts