

Question: More Graphing Practice - Complete the following graph analysis. Practice: Use the situation and the data provided to create a graph and answer the questions.
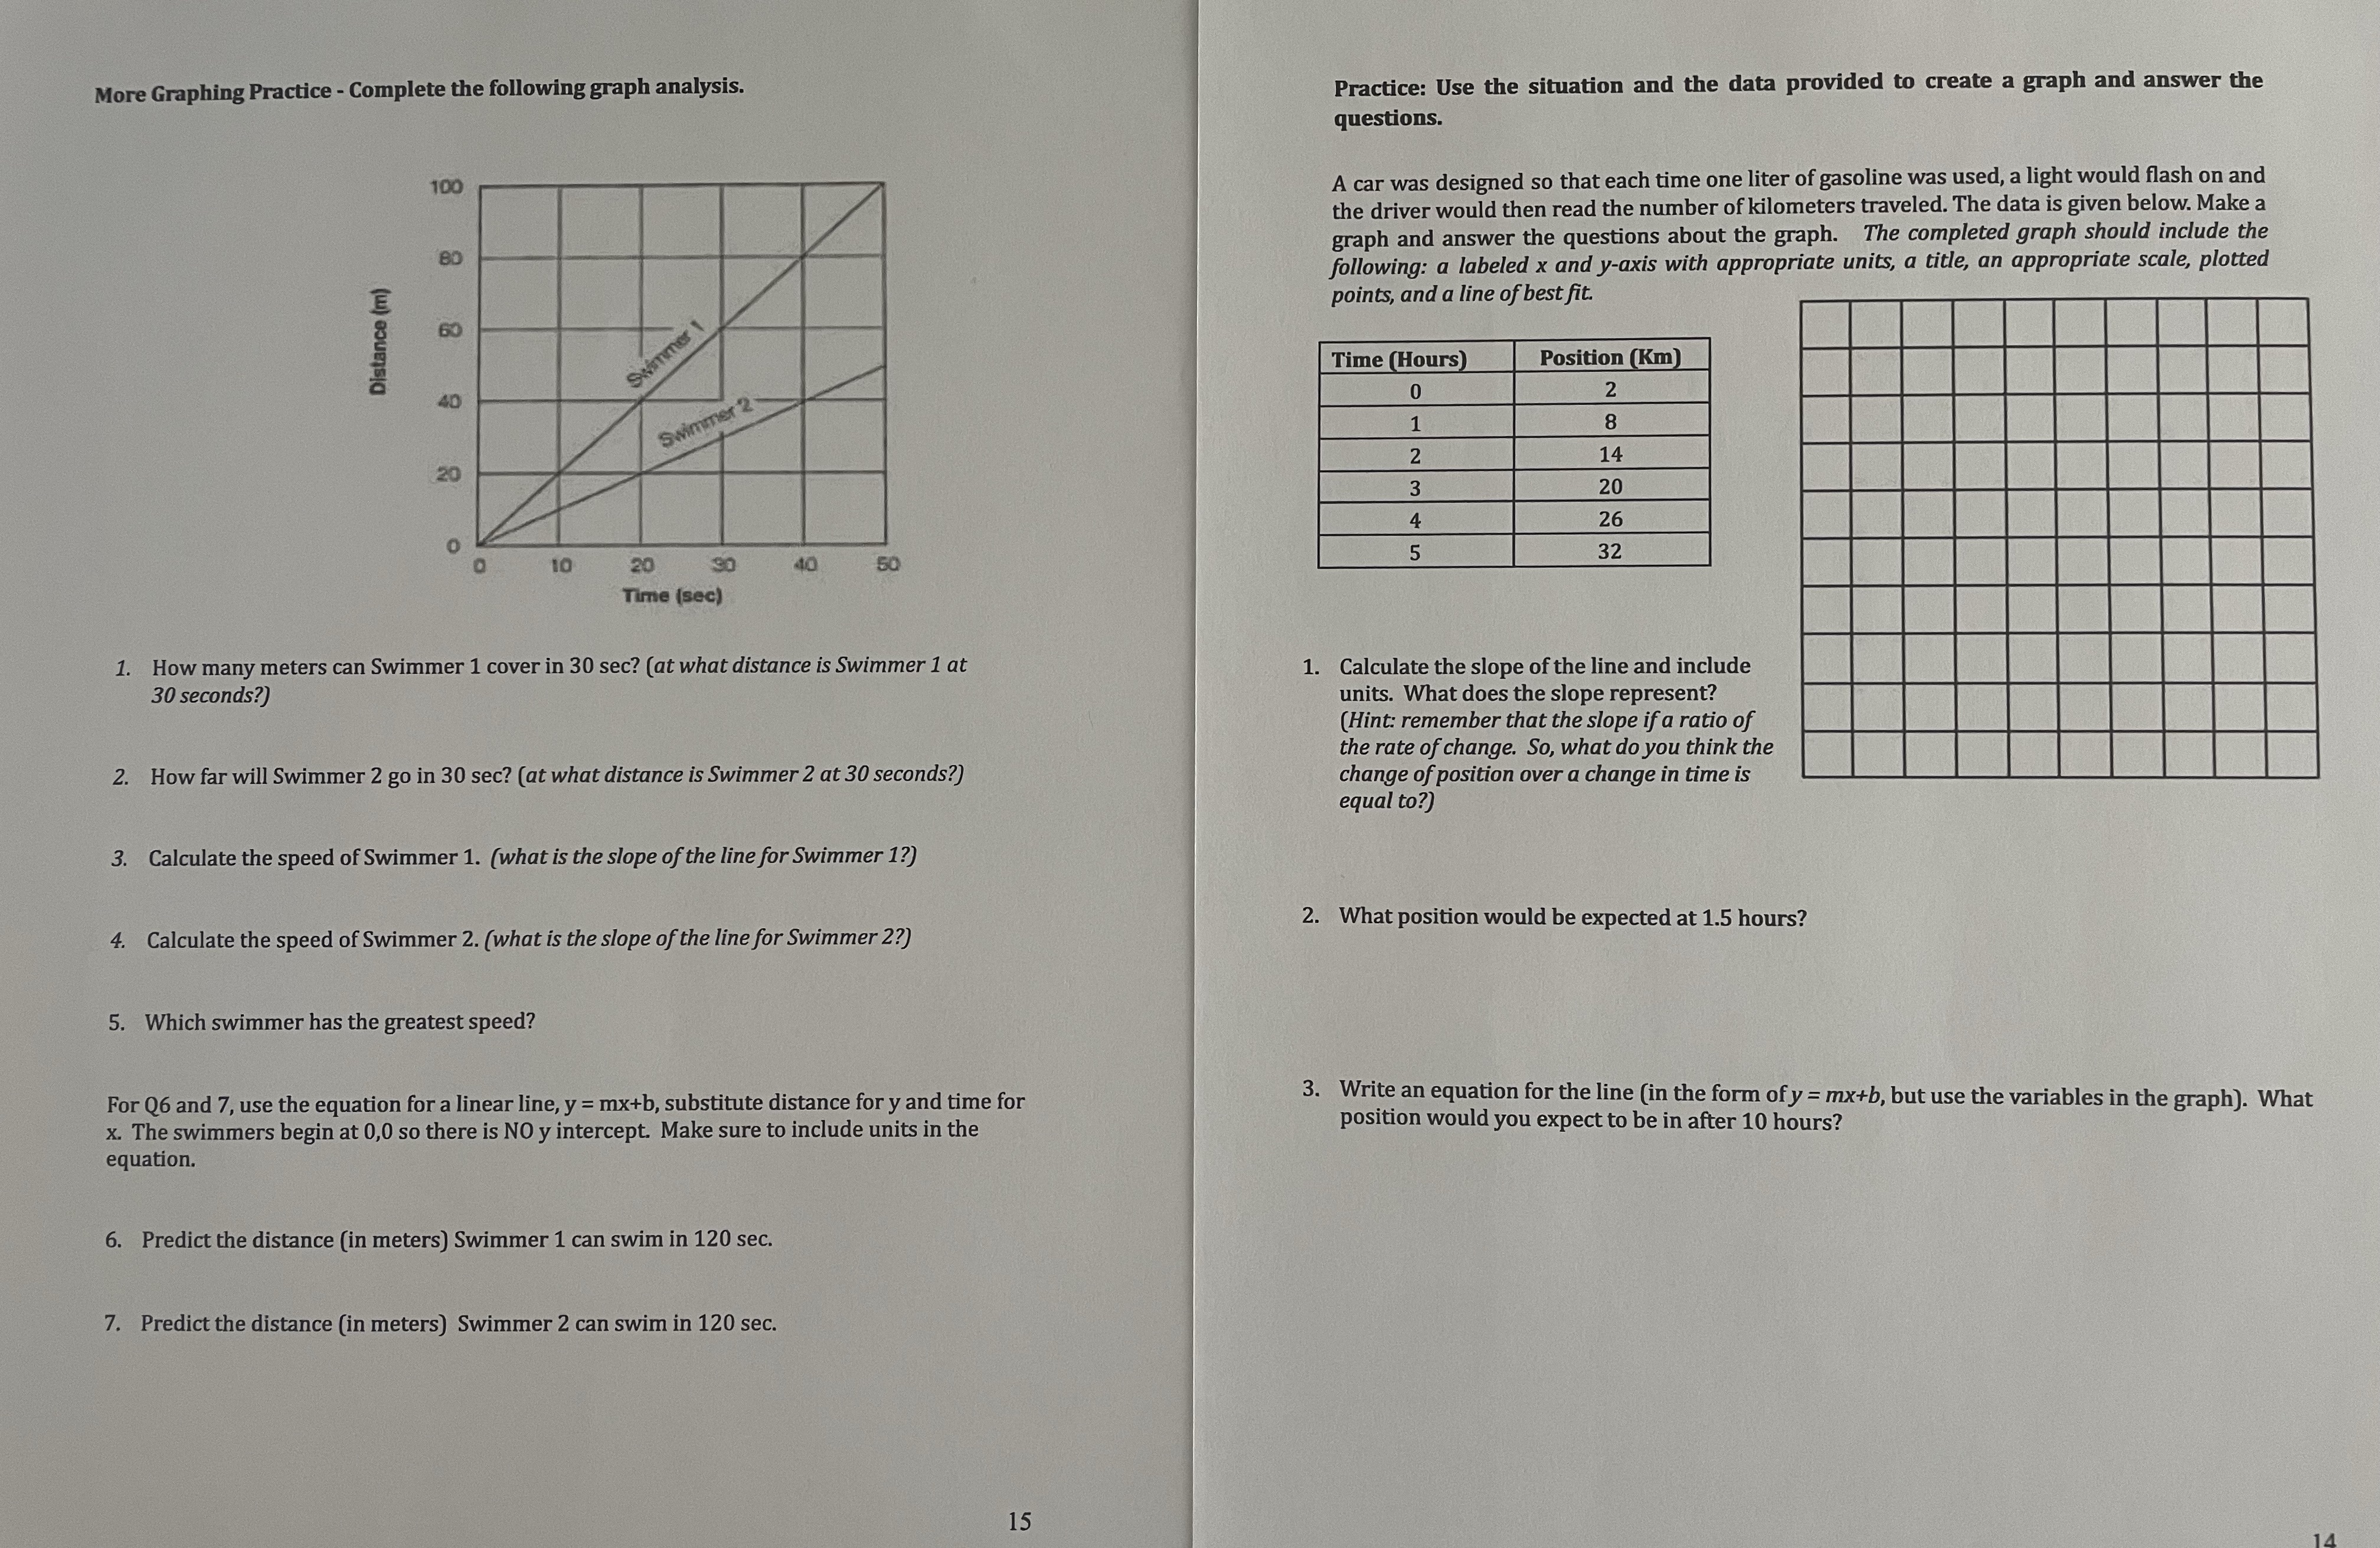
More Graphing Practice - Complete the following graph analysis. Practice: Use the situation and the data provided to create a graph and answer the questions. 100 A car was designed so that each time one liter of gasoline was used, a light would flash on and the driver would then read the number of kilometers traveled. The data is given below. Make a graph and answer the questions about the graph. The completed graph should include the following: a labeled x and y-axis with appropriate units, a title, an appropriate scale, plotted points, and a line of best fit. 60 Distance (m) Time (Hours) Position (Km) 0 2 Swimmer 2 8 14 20 2 20 26 32 10 20 30 40 50 Time (sec) 1. How many meters can Swimmer 1 cover in 30 sec? (at what distance is Swimmer 1 at 1. Calculate the slope of the line and include 30 seconds?) units. What does the slope represent? (Hint: remember that the slope if a ratio of the rate of change. So, what do you think the 2. How far will Swimmer 2 go in 30 sec? (at what distance is Swimmer 2 at 30 seconds?) change of position over a change in time is equal to?) 3. Calculate the speed of Swimmer 1. (what is the slope of the line for Swimmer 1?) 2. What position would be expected at 1.5 hours? 4. Calculate the speed of Swimmer 2. (what is the slope of the line for Swimmer 2?) 5. Which swimmer has the greatest speed? For Q6 and 7, use the equation for a linear line, y = mx+b, substitute distance for y and time for 3. Write an equation for the line (in the form of y = mx+b, but use the variables in the graph). What <. the swimmers begin at so there is no y intercept. make sure to include units in position would you expect be after hours equation. predict distance meters swimmer can swim sec.>
Step by Step Solution
There are 3 Steps involved in it

Get step-by-step solutions from verified subject matter experts