

Question: More Info Factors for calculating three - sigma limits for the ( overline { mathrm { x } } ) -
More Info
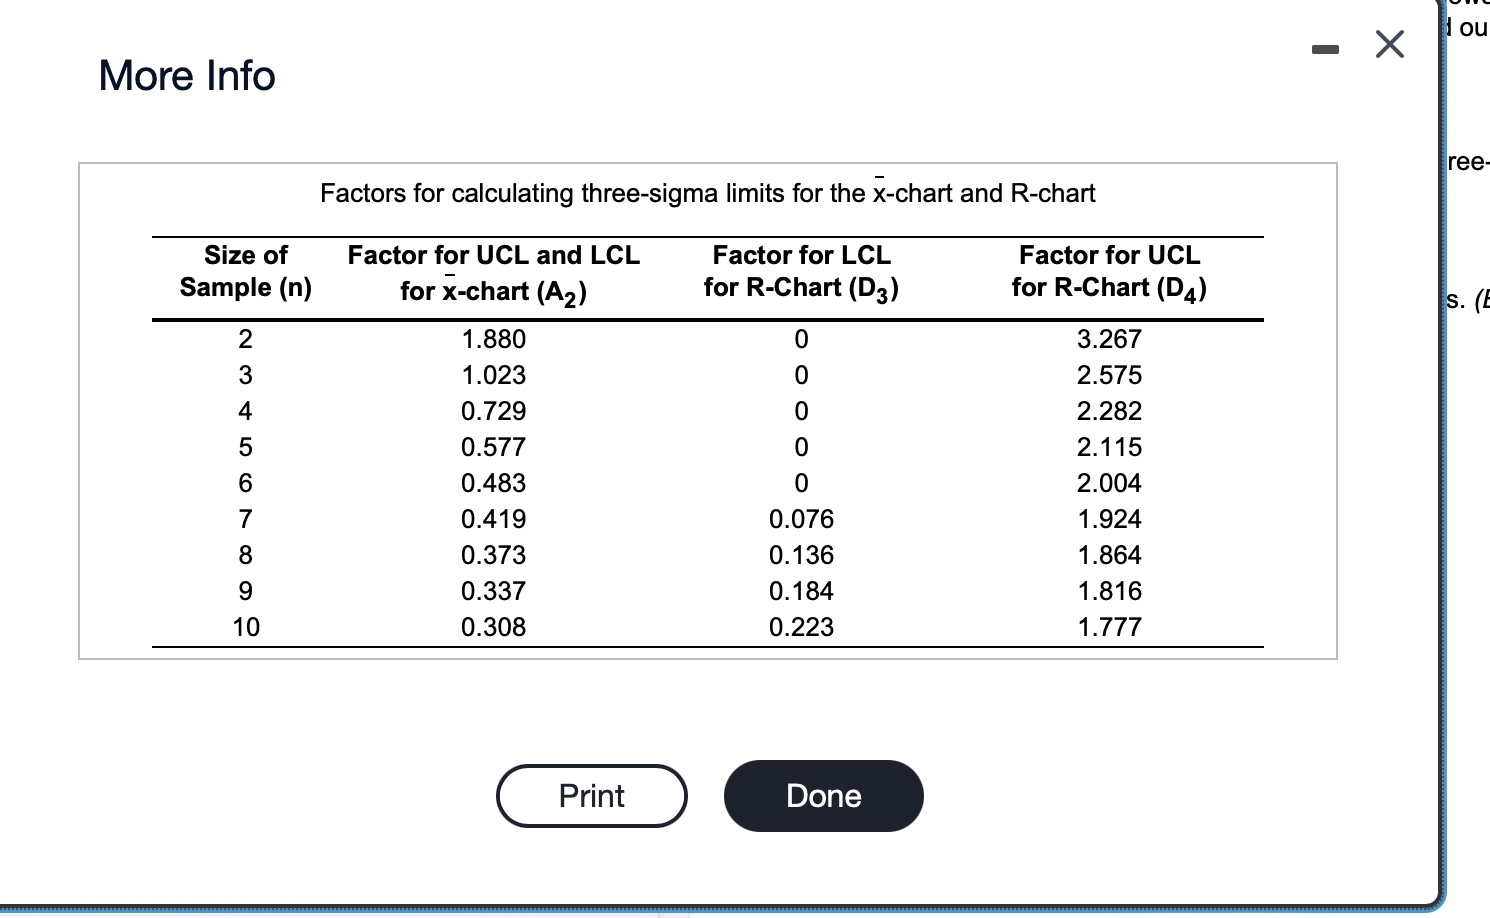
Factors for calculating threesigma limits for the overlinemathrmxchart and Rchart
begintabularcccc
hline begintabularc
Size of
Sample mathbfn
endtabular & begintabularc
Factor for UCL and LCL
for overlinemathbfxchart leftmathbfAmathbfright
endtabular & begintabularc
Factor for LCL
for RChart leftmathbfDmathbfright
endtabular & begintabularc
Factor for UCL
for RChart leftmathbfDmathbfright
endtabular
hline & & &
& & &
& & &
& & &
& & &
& & &
& & &
& & &
& & &
hline
endtabular
s Data Table
ounce
desi
roces
begintabularccccc
hline multicolumnc Question Viewer
cline & multicolumnc Bottle &
hline Sample & mathbf & mathbf & mathbf & mathbf
hline & & & &
& & & &
& & & &
& & & &
& & & &
& & & &
& & & &
& & & &
& & & &
& & & &
& & & &
& & & &
& & & &
& & & &
& & & &
hline
endtabular The production manager at Sunny Soda, Inc., is interested in tracking the quality of the company's ounce bottle filling line. The bottles must be filled within the tolerances set ff cause the dietary information on the label shows ounces as the serving size. The design standard for the product calls for a fill level of pm ounces. mathrmTtext anaye cunected the accompanying sample data in fluid ounces per bottle on the production process.Click the icon to view the sample data.
Click the icon to view the table of factors for calculating threesigma limits for the overlinemathrmxchart and Rchart.
Design an R and an barxchart for this process.
The U C LR equals ounces and the L C LR equals ounces. Enter your responses rounded to three decimal places.
Step by Step Solution
There are 3 Steps involved in it
1 Expert Approved Answer
Step: 1 Unlock

Question Has Been Solved by an Expert!
Get step-by-step solutions from verified subject matter experts
Step: 2 Unlock
Step: 3 Unlock