

Question: More Info Factors for calculating three-sigma limits for the x-chart and R-chart Click the icon to view the table of factors for calculating three-sigma limits
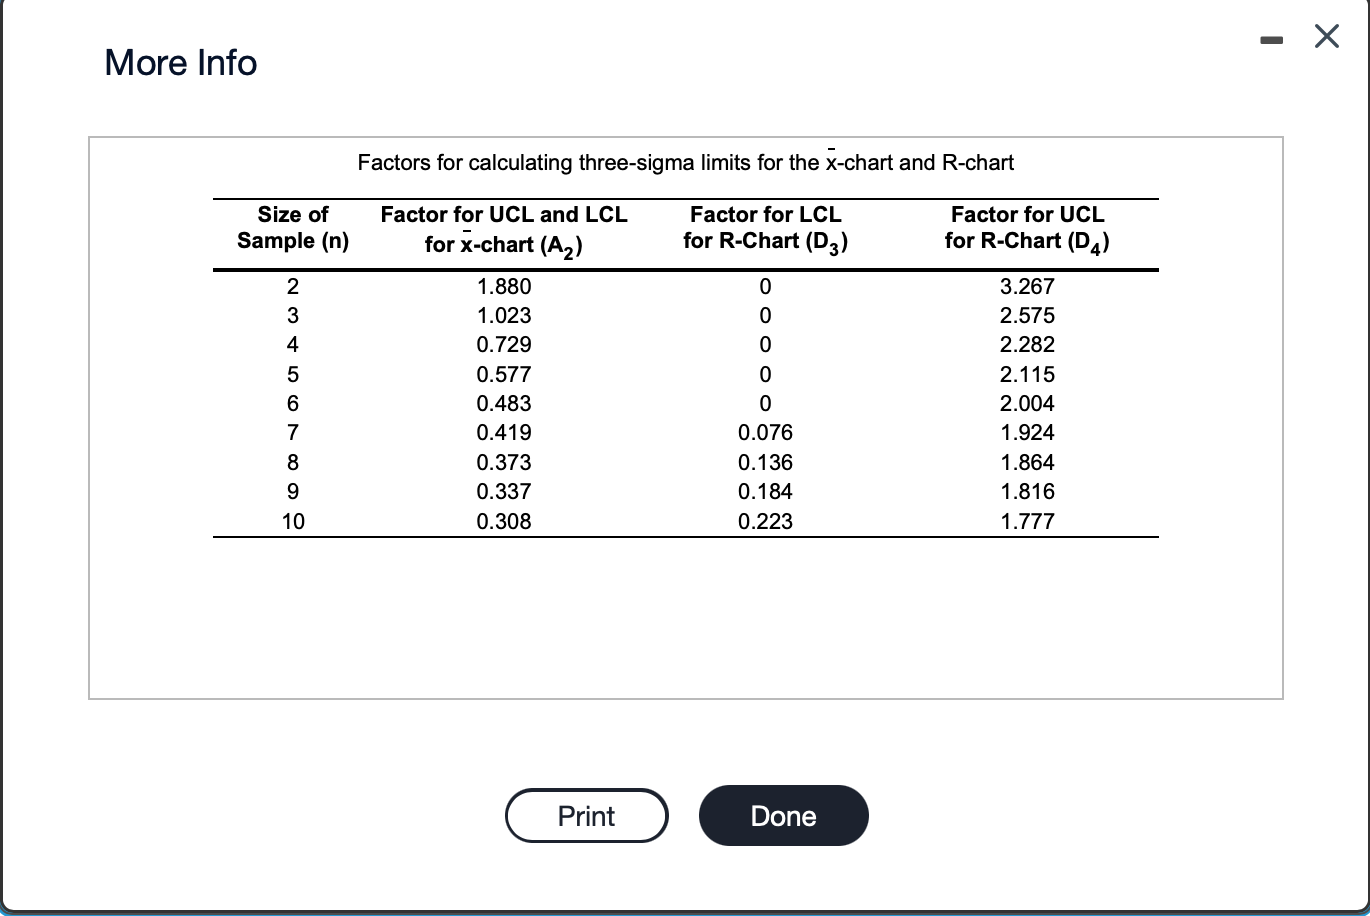
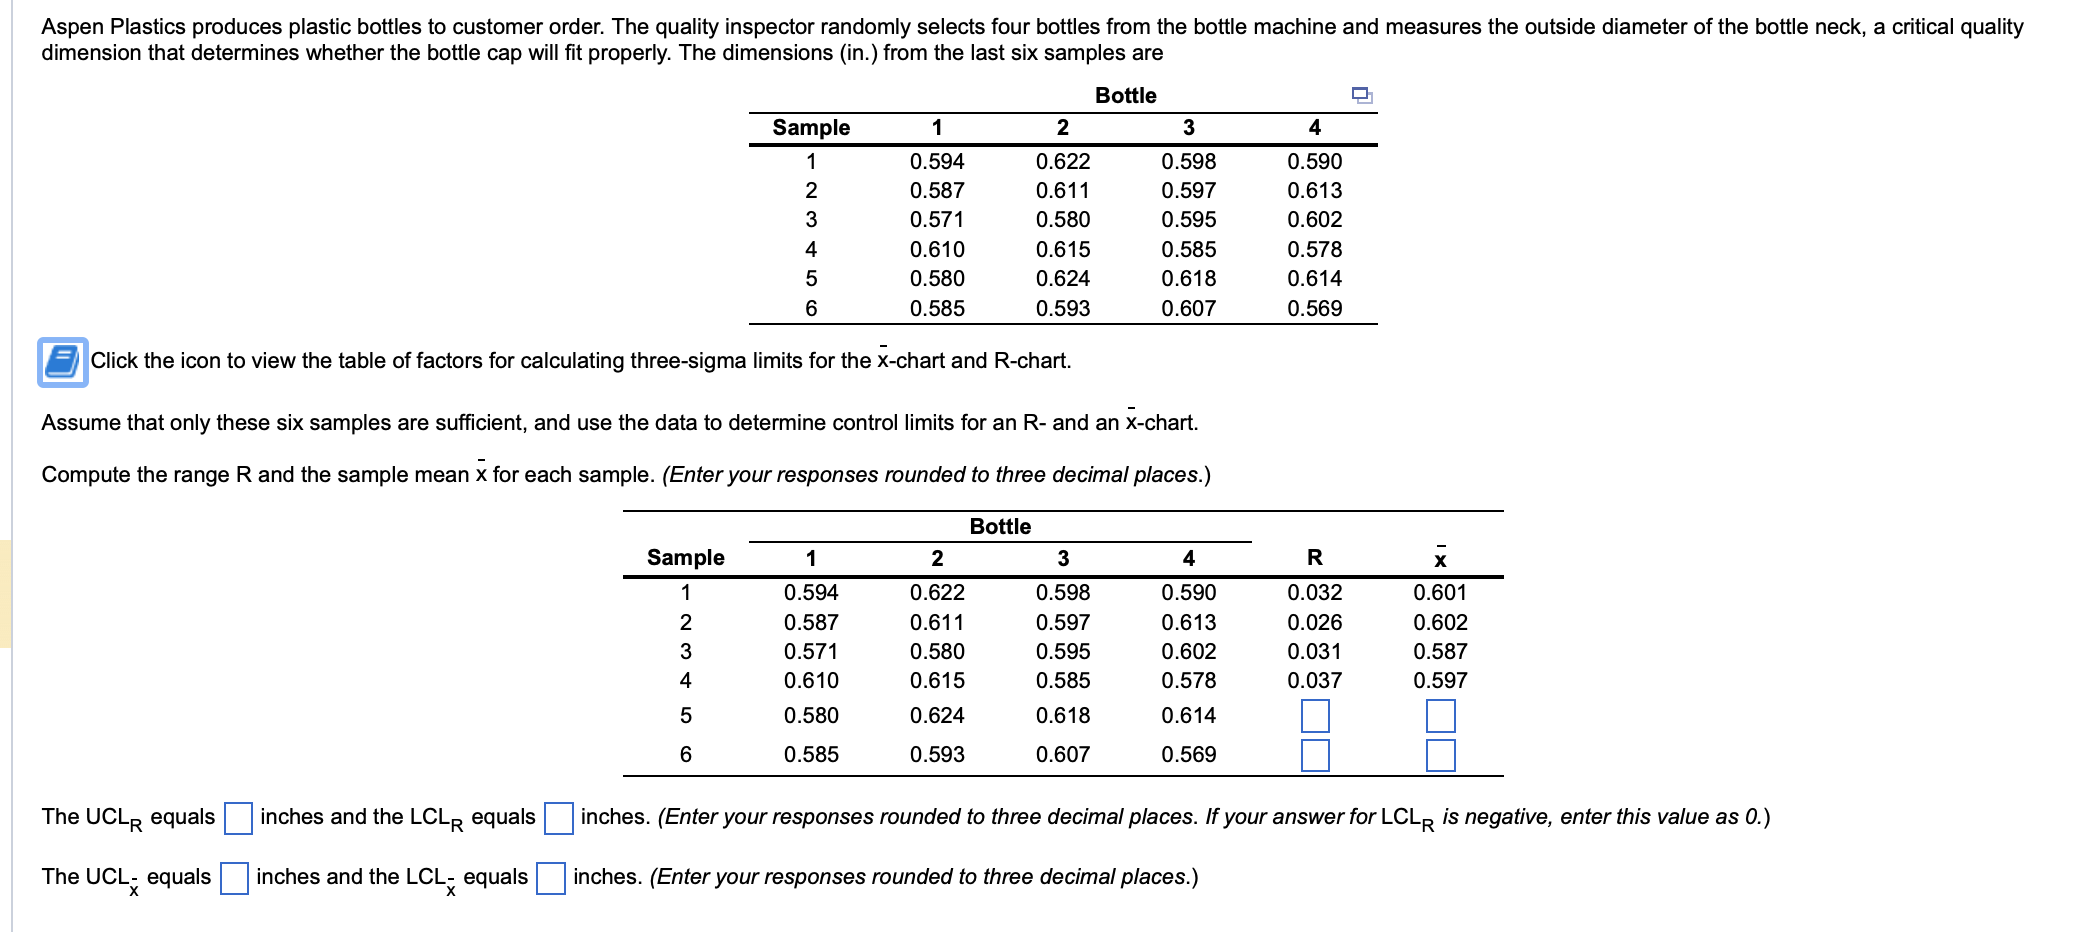
More Info Factors for calculating three-sigma limits for the x-chart and R-chart Click the icon to view the table of factors for calculating three-sigma limits for the x-chart and R-chart. Assume that only these six samples are sufficient, and use the data to determine control limits for an R - and an x-chart. Compute the range R and the sample mean x for each sample. (Enter your responses rounded to three decimal places.) The UCLR equals inches and the LCLR equals inches. (Enter your responses rounded to three decimal places. If your answer for LCLR is negative, enter this value as 0 .) The UCLx equals inches and the LCLx equals inches. (Enter your responses rounded to three decimal places.)
Step by Step Solution
There are 3 Steps involved in it

Get step-by-step solutions from verified subject matter experts