

Question: Most application depends on data. In loT data is collected/generate by sensors. Since, we do not have access to sensors, we will have to
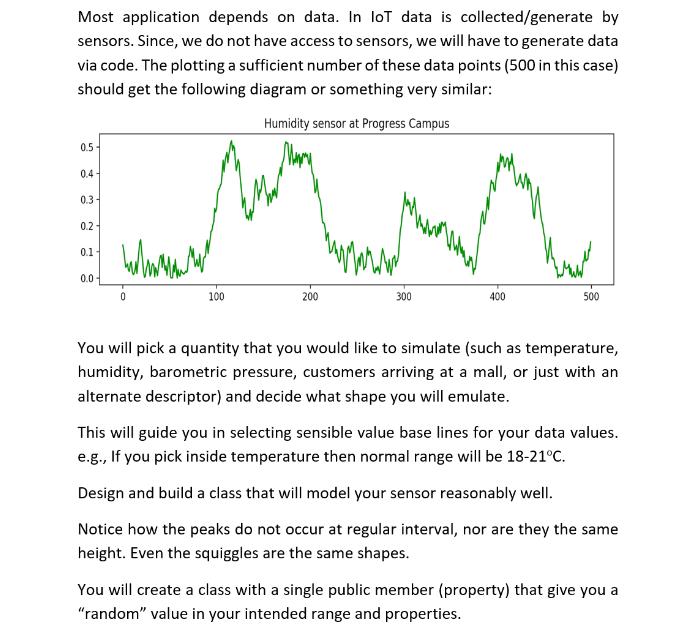
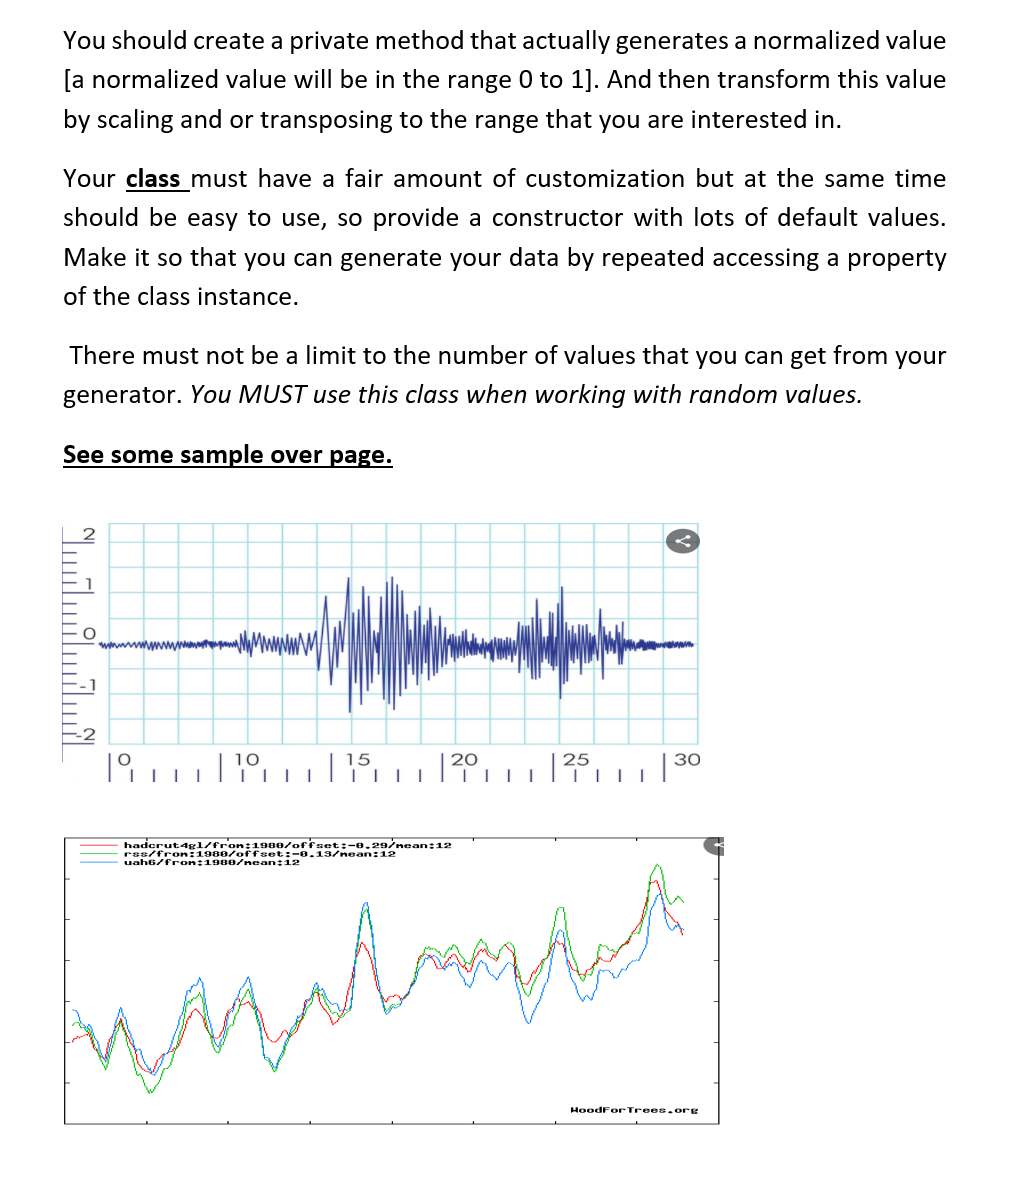
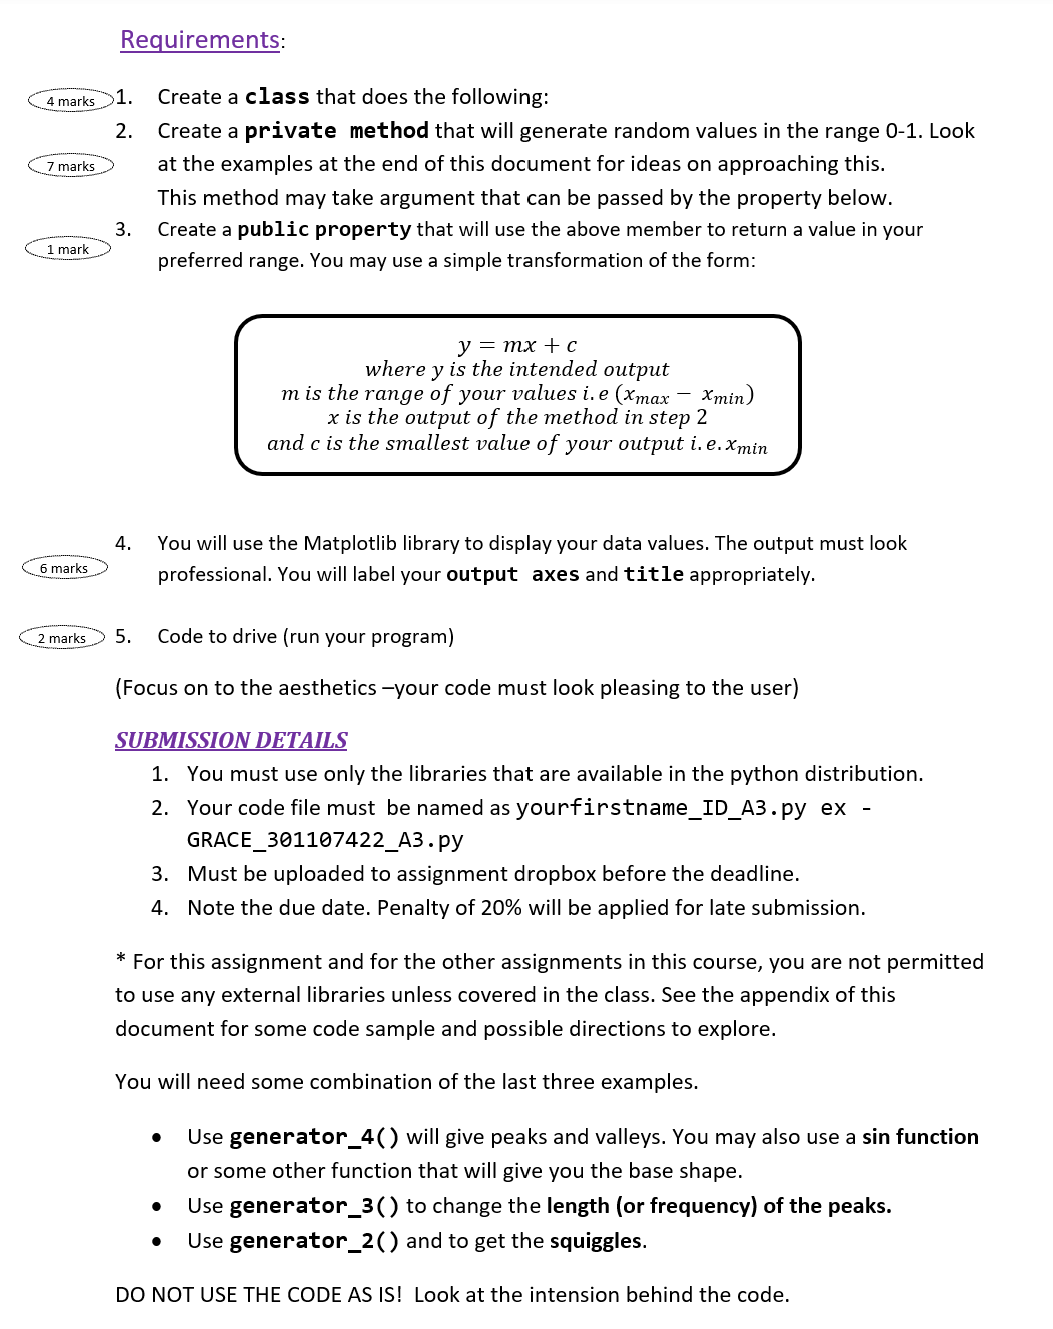
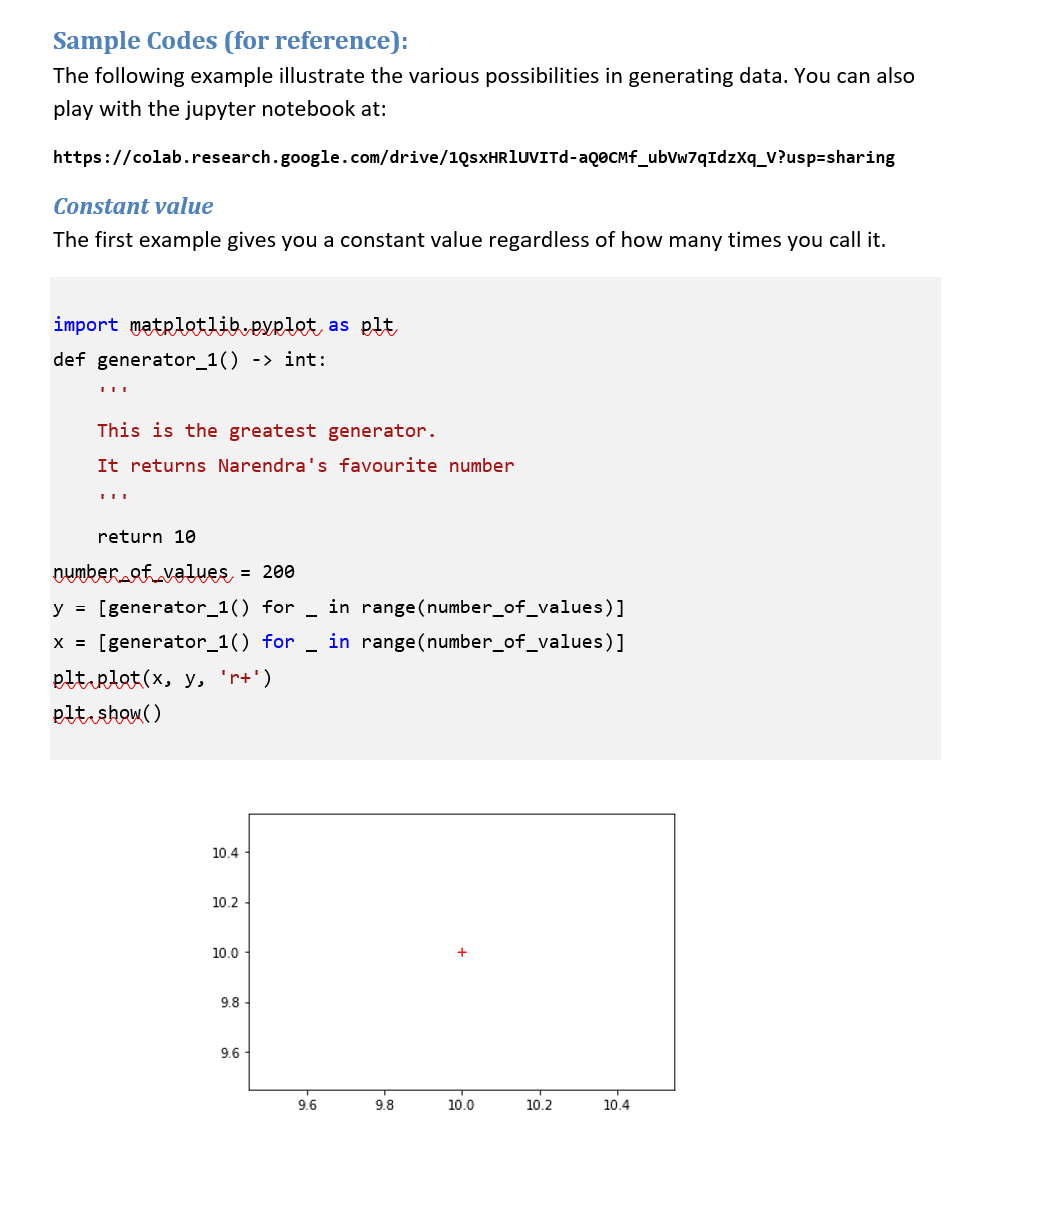
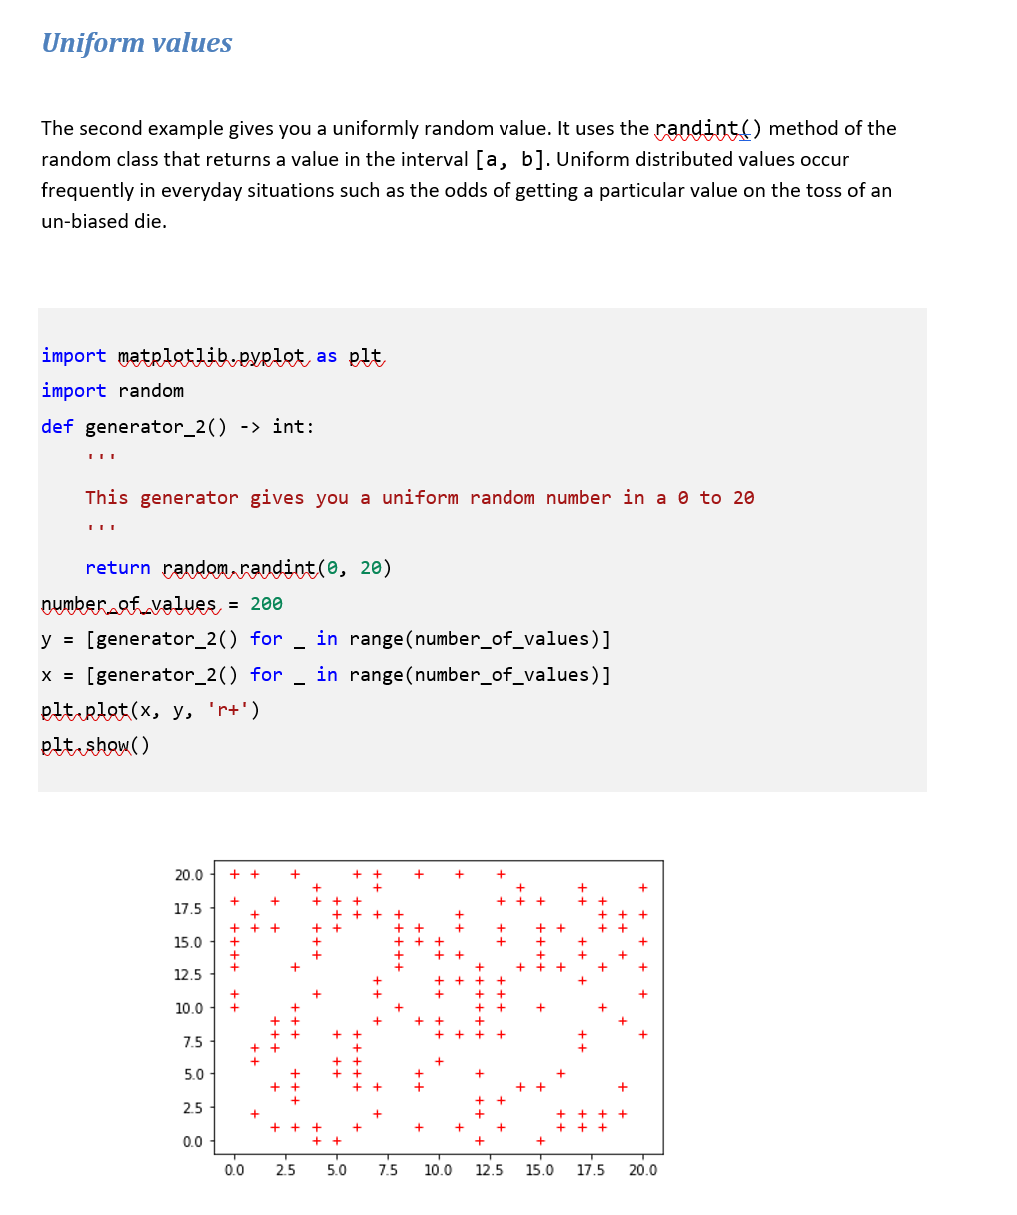
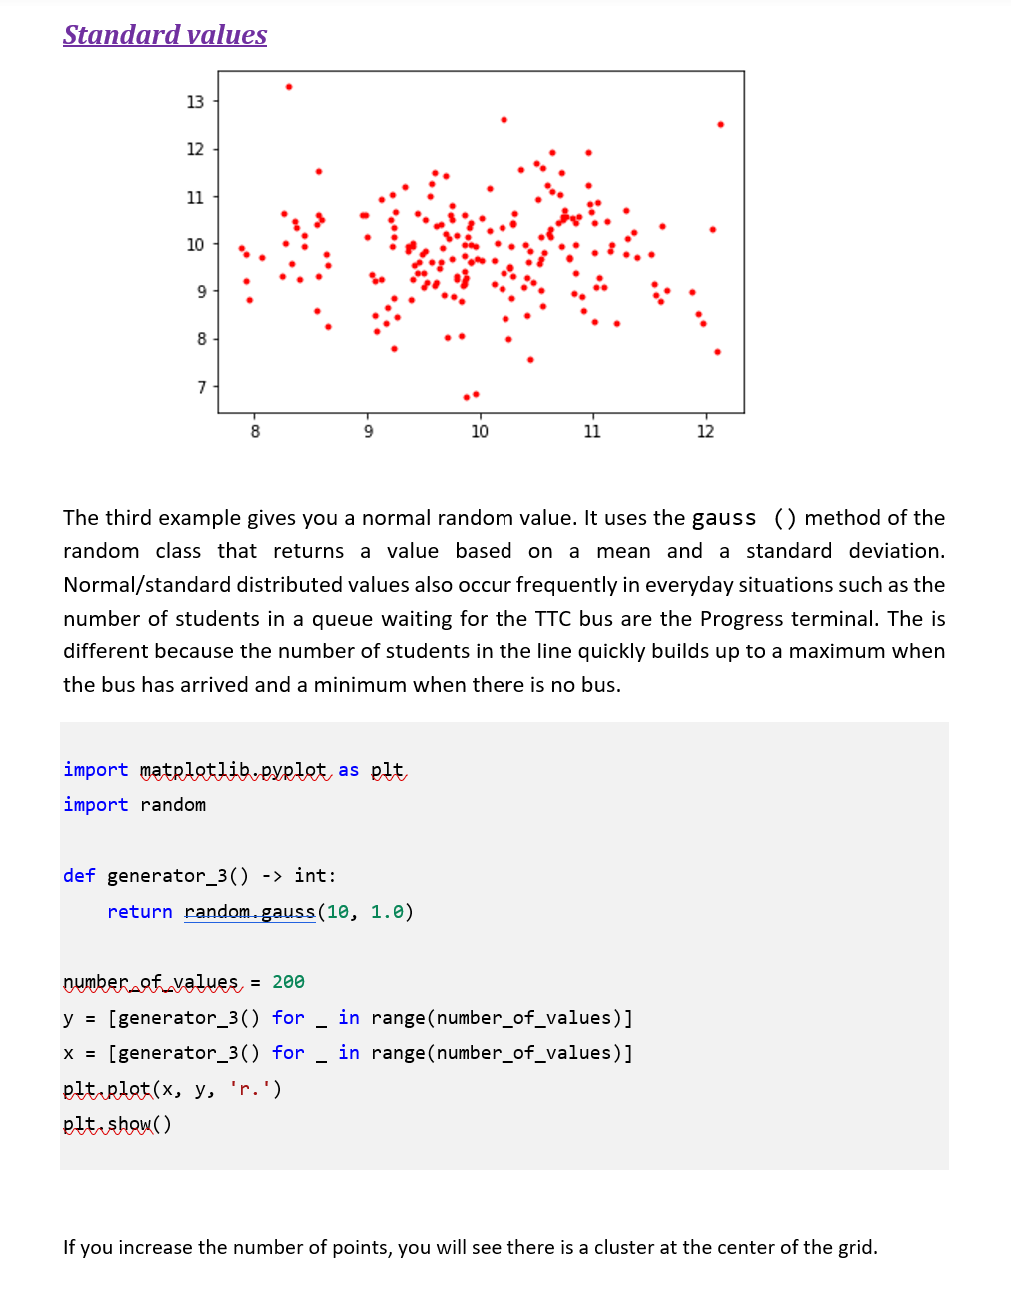
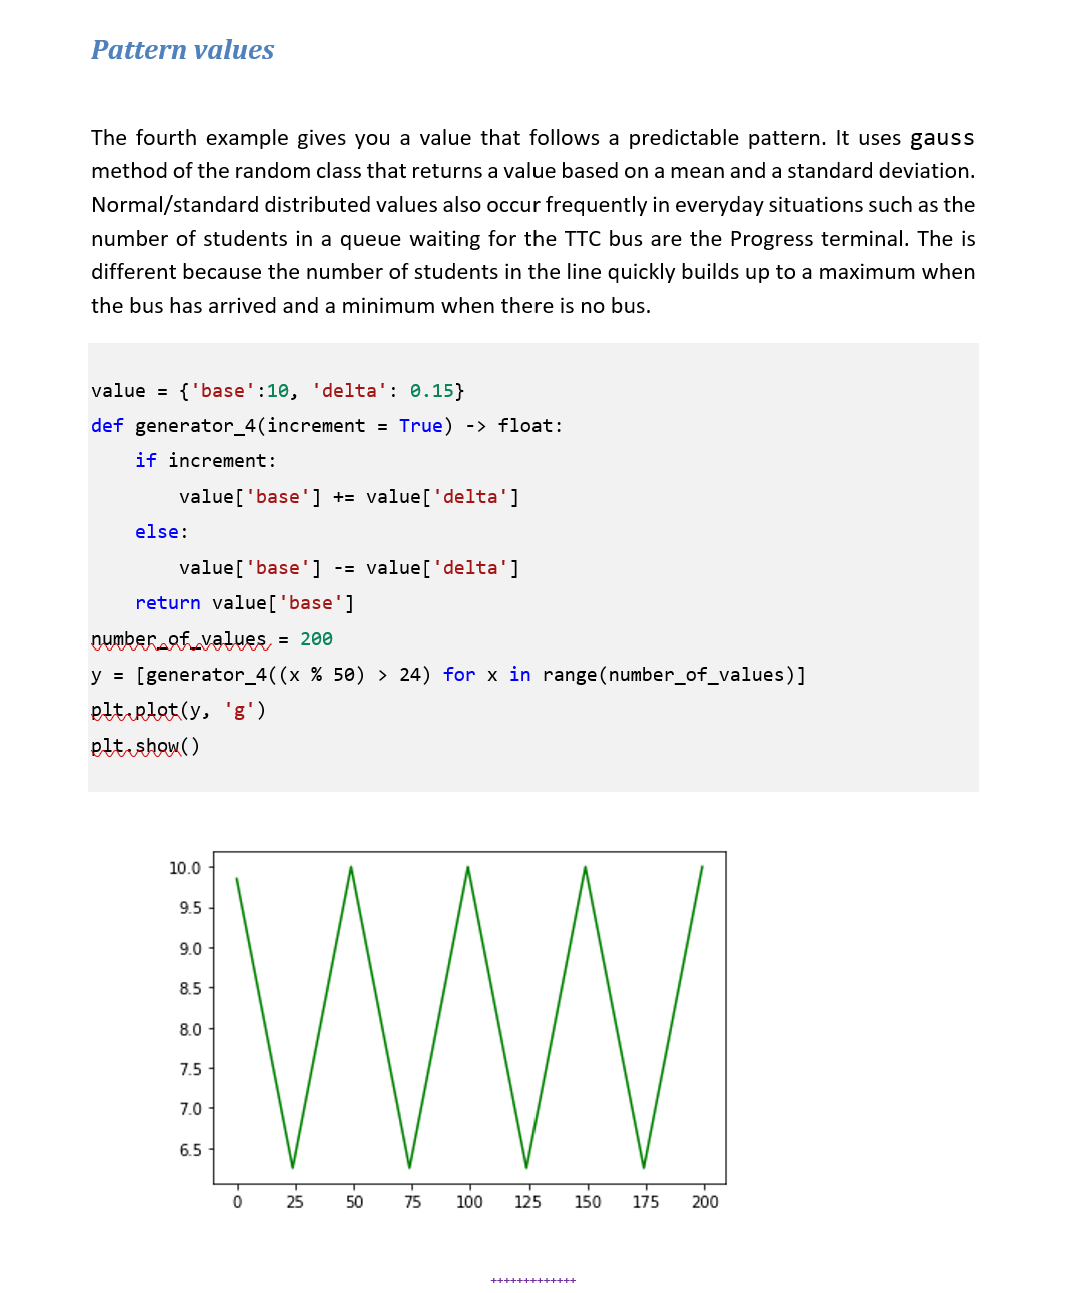
Most application depends on data. In loT data is collected/generate by sensors. Since, we do not have access to sensors, we will have to generate data via code. The plotting a sufficient number of these data points (500 in this case) should get the following diagram or something very similar: Humidity sensor at Progress Campus 0.5 0.4- 0.3- 0.2- 0.1 0.0 0 100 200 300 www 400 Wow 500 You will pick a quantity that you would like to simulate (such as temperature, humidity, barometric pressure, customers arriving at a mall, or just with an alternate descriptor) and decide what shape you will emulate. This will guide you in selecting sensible value base lines for your data values. e.g., If you pick inside temperature then normal range will be 18-21C. Design and build a class that will model your sensor reasonably well. Notice how the peaks do not occur at regular interval, nor are they the same height. Even the squiggles are the same shapes. You will create a class with a single public member (property) that give you a "random" value in your intended range and properties. You should create a private method that actually generates a normalized value [a normalized value will be in the range 0 to 1]. And then transform this value by scaling and or transposing to the range that you are interested in. Your class must have a fair amount of customization but at the same time should be easy to use, so provide a constructor with lots of default values. Make it so that you can generate your data by repeated accessing a property of the class instance. There must not be a limit to the number of values that you can get from your generator. You MUST use this class when working with random values. See some sample over page. 1910 15 20 25 I I hadcrut4g1/fron;1900/offset:-0.29/nean:12 rss/fron:1980/offset:-0.13/nean:12 uah6/fron: 1988/nean:12 | | | 30 kumt HoodForTrees.org 4 marks 7 marks 1 mark 6 marks 2 marks Requirements: Create a class that does the following: Create a private method that will generate random values in the range 0-1. Look at the examples at the end of this document for ideas on approaching this. 1. 2. 3. 4. This method may take argument that can be passed by the property below. Create a public property that will use the above member to return a value in your preferred range. You may use a simple transformation of the form: 5. y = mx +c where y is the intended output m is the range of your values i. e (xmax - xmin) x is the output of the method in step 2 and c is the smallest value of your output i. e.xmin You will use the Matplotlib library to display your data values. The output must look professional. You will label your output axes and title appropriately. Code to drive (run your program) (Focus on to the aesthetics -your code must look pleasing to the user) SUBMISSION DETAILS 1. You must use only the libraries that are available in the python distribution. 2. Your code file must be named as yourfirstname_ID_A3.py ex - GRACE_301107422_A3.py 3. Must be uploaded to assignment dropbox before the deadline. 4. Note the due date. Penalty of 20% will be applied for late submission. * For this assignment and for the other assignments in this course, you are not permitted to use any external libraries unless covered in the class. See the appendix of this document for some code sample and possible directions to explore. You will need some combination of the last three examples. Use generator_4() will give peaks and valleys. You may also use a sin function or some other function that will give you the base shape. Use generator_3() to change the length (or frequency) of the peaks. Use generator_2() and to get the squiggles. DO NOT USE THE CODE AS IS! Look at the intension behind the code. Sample Codes (for reference): The following example illustrate the various possibilities in generating data. You can also play with the jupyter notebook at: https://colab.research.google.com/drive/1QsxHR1UVITd-aQ0CMf_ubVw7qIdzXq_V?usp=sharing Constant value The first example gives you a constant value regardless of how many times you call it. import matplotlib.pyplot as plt def generator_1() -> int: This is the greatest generator. It returns Narendra's favourite number III return 10 number of values, = 200 y = [generator_1() for in range (number_of_values)] x= [generator_1() for in range(number_of_values)] plt.plot(x, y, 'r+') plt.show() 10.4 10.2 10.0 9.8 9.6 9.6 9.8 + 10.0 10.2 10.4 Uniform values The second example gives you a uniformly random value. It uses the randint() method of the random class that returns a value in the interval [a, b]. Uniform distributed values occur frequently in everyday situations such as the odds of getting a particular value on the toss of an un-biased die. import matplotlib.pyplot as plt import random def generator_2() -> int: III This generator gives you a uniform random number in a 0 to 20 return random.randint(0, 20) number of values, = 200 y = [generator_2() for in range (number_of_values)] x = [generator_2() for in range(number_of_values)] plt.plot(x, y, 'r+') plt.show() 20.0 17.5 15.0 12.5 10.0 7.5 5.0 2.5 0.0 + + + + + 0.0 + + + + + 2.5 + + 5.0 + + 7.5 + + + + 10.0 12.5 + + + + + * + + + 15.0 17.5 20.0 Standard values 13 12 11 10 9 8 7 8 Sh 9 def generator_3() -> import matplotlib.pyplot as plt import random 10 The third example gives you a normal random value. It uses the gauss () method of the random class that returns a value based on a mean and a standard deviation. Normal/standard distributed values also occur frequently in everyday situations such as the number of students in a queue waiting for the TTC bus are the Progress terminal. The is different because the number of students in the line quickly builds up to a maximum when the bus has arrived and a minimum when there is no bus. return random.gauss(10, 1.0) 11 12 number of values, = 200 y = [generator_3() for in range(number_of_values)] in range (number_of_values)] x = [generator_3() for elt plot(x, y, 'r.') plt show() If you increase the number of points, you will see there is a cluster at the center of the grid. Pattern values The fourth example gives you a value that follows a predictable pattern. It uses gauss method of the random class that returns a value based on a mean and a standard deviation. Normal/standard distributed values also occur frequently in everyday situations such as the number of students in a queue waiting for the TTC bus are the Progress terminal. The is different because the number of students in the line quickly builds up to a maximum when the bus has arrived and a minimum when there is no bus. value = {'base':10, 'delta': 0.15} def generator_4(increment = True) -> float: if increment: value ['base'] += value['delta'] else: value ['base'] -= value['delta'] return value ['base'] number of values = 200 y = [generator_4((x % 50) > 24) for x in range(number_of_values)] plt.plot(y, 'g') plt.show() 10.0 9.5 9.0 8.5 8.0 7.5 7.0 6.5 WW 100 0 25 50 T 75 | 125 +++++++++++++ 150 175 200
Step by Step Solution
There are 3 Steps involved in it

Get step-by-step solutions from verified subject matter experts