

Question: Most Likely Best Case Scenario Worst Case Scenario Hint Given: Most Likely NPV of $554,942, IRR of 11.35% and MIRR of 10.21 with 5.3 year
Most Likely
Best Case Scenario
Worst Case Scenario
Hint Given: Most Likely NPV of $554,942, IRR of 11.35% and MIRR of 10.21 with 5.3 year payback......
Best case NPV of 4,655,501, IRR of 29.89% and MIRR of 19.53% with payback of 3.13 years......
Worst case NPV of ($2,045,516), IRR of -2.95% and MIRR of .22% with no payback occurring by end of year 7
The excel spreadsheets need to be completed above to complete the info below.
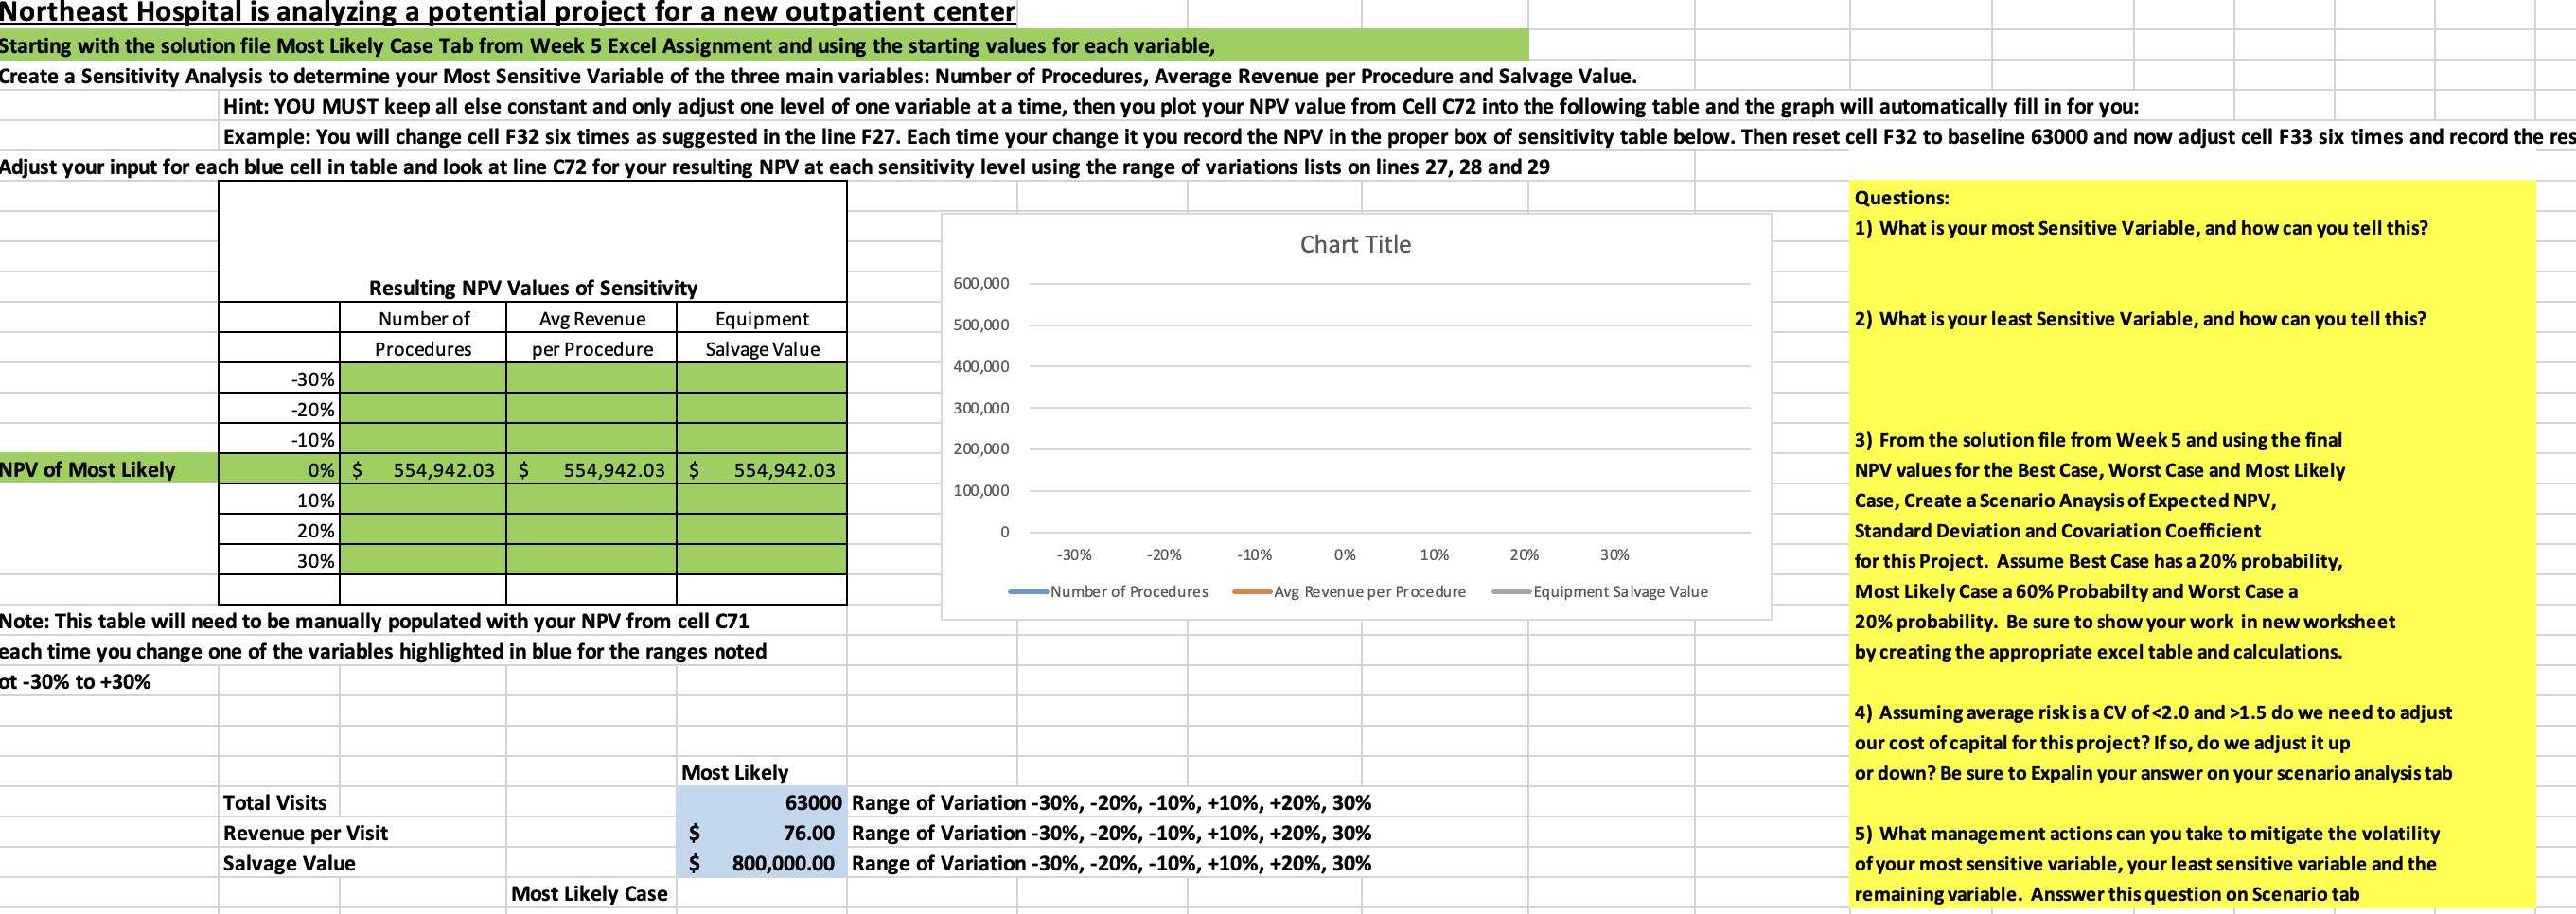
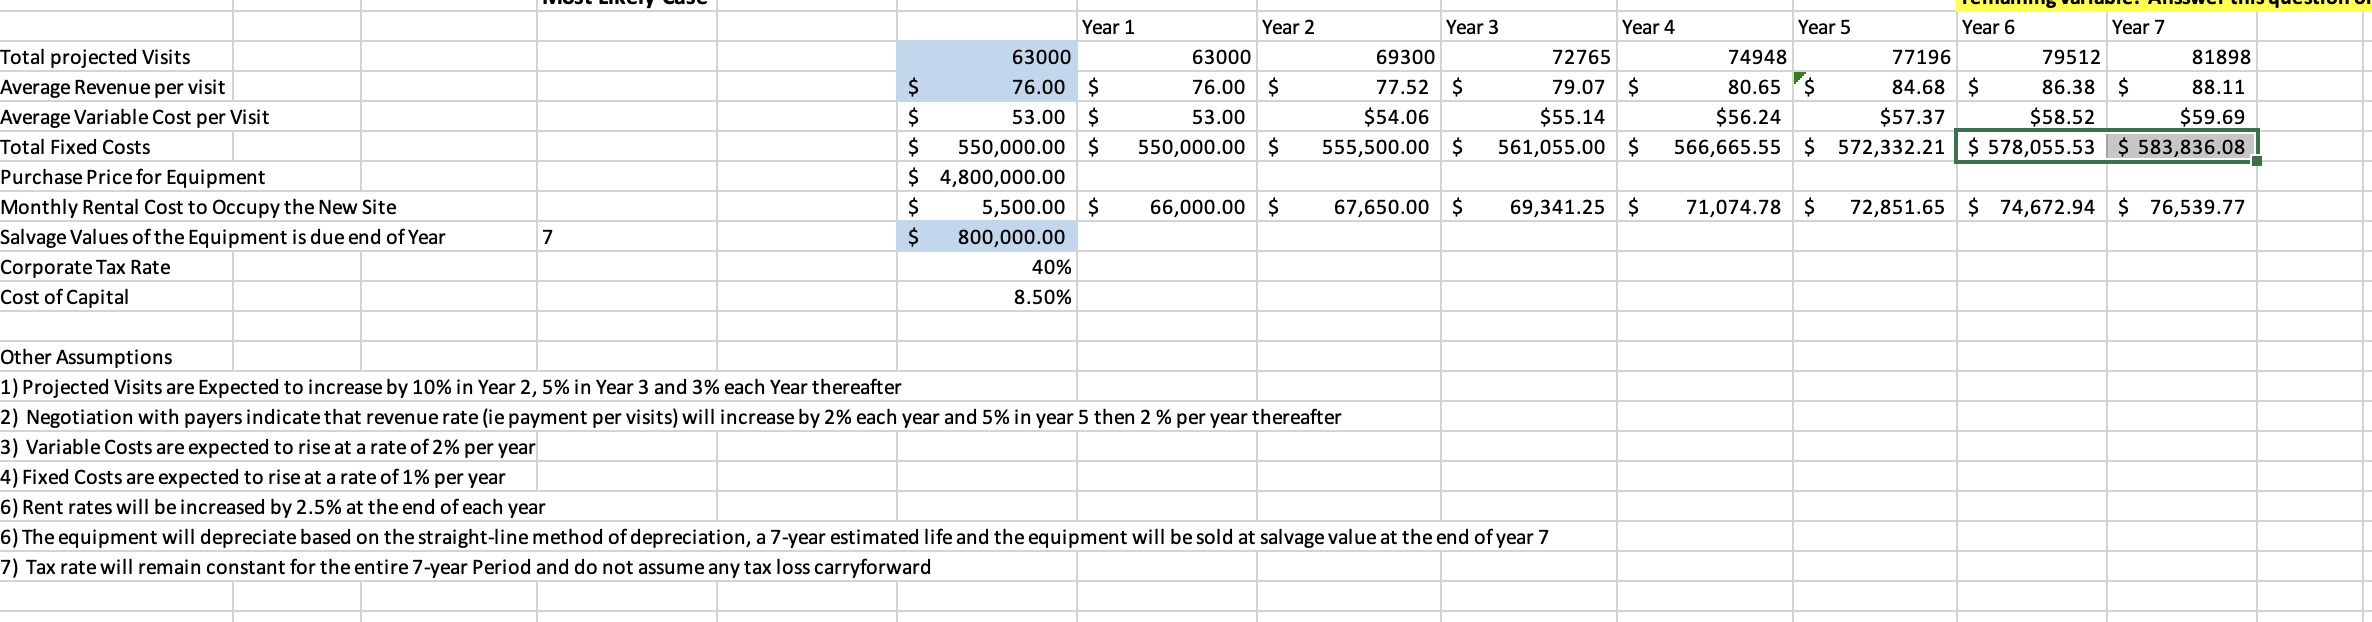
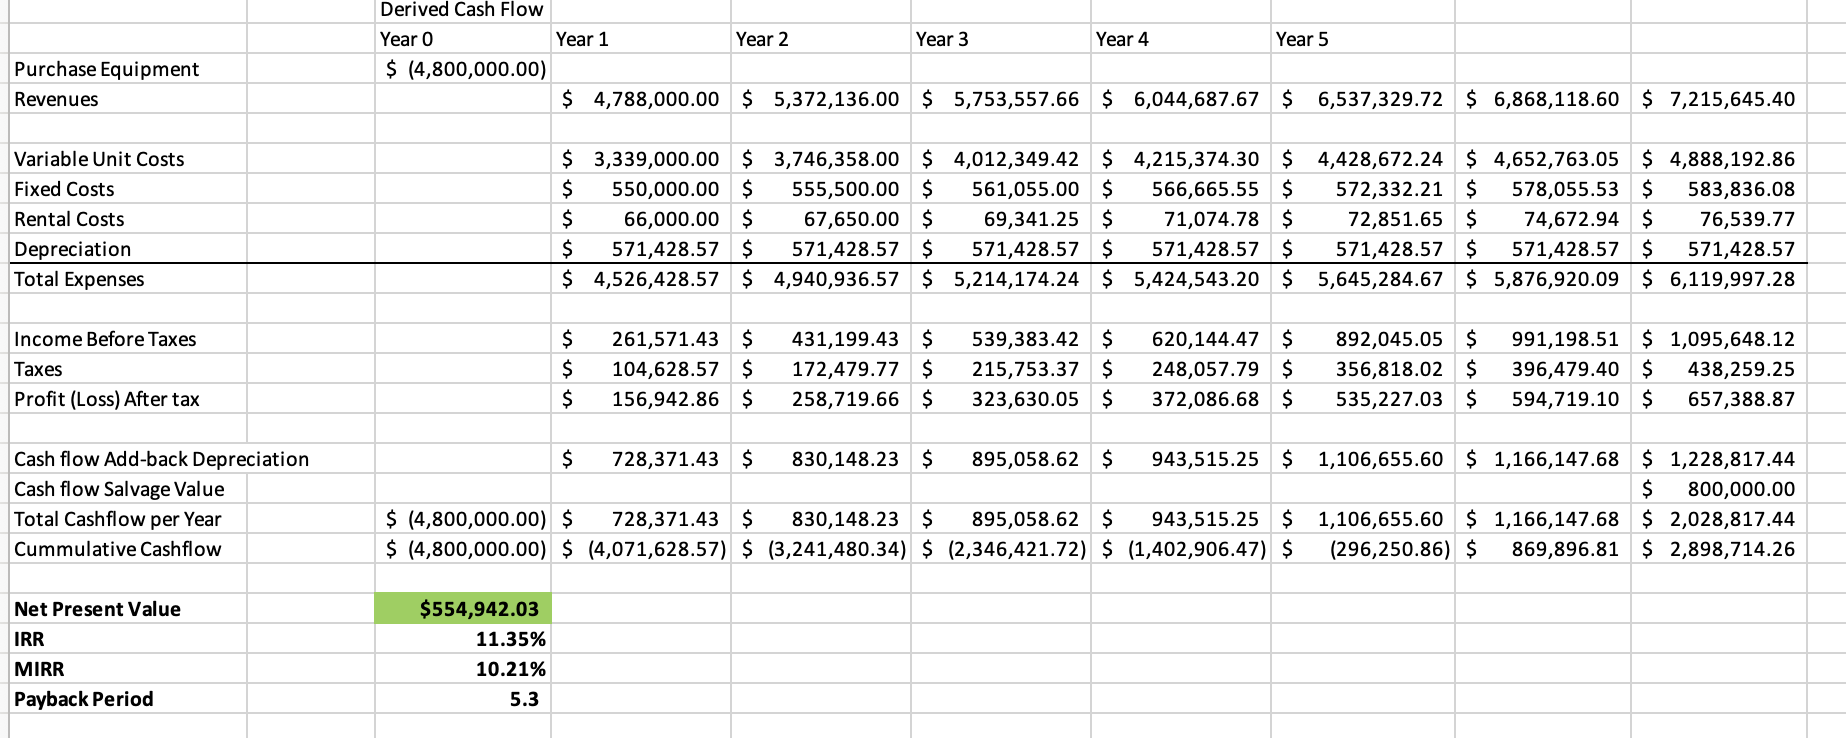
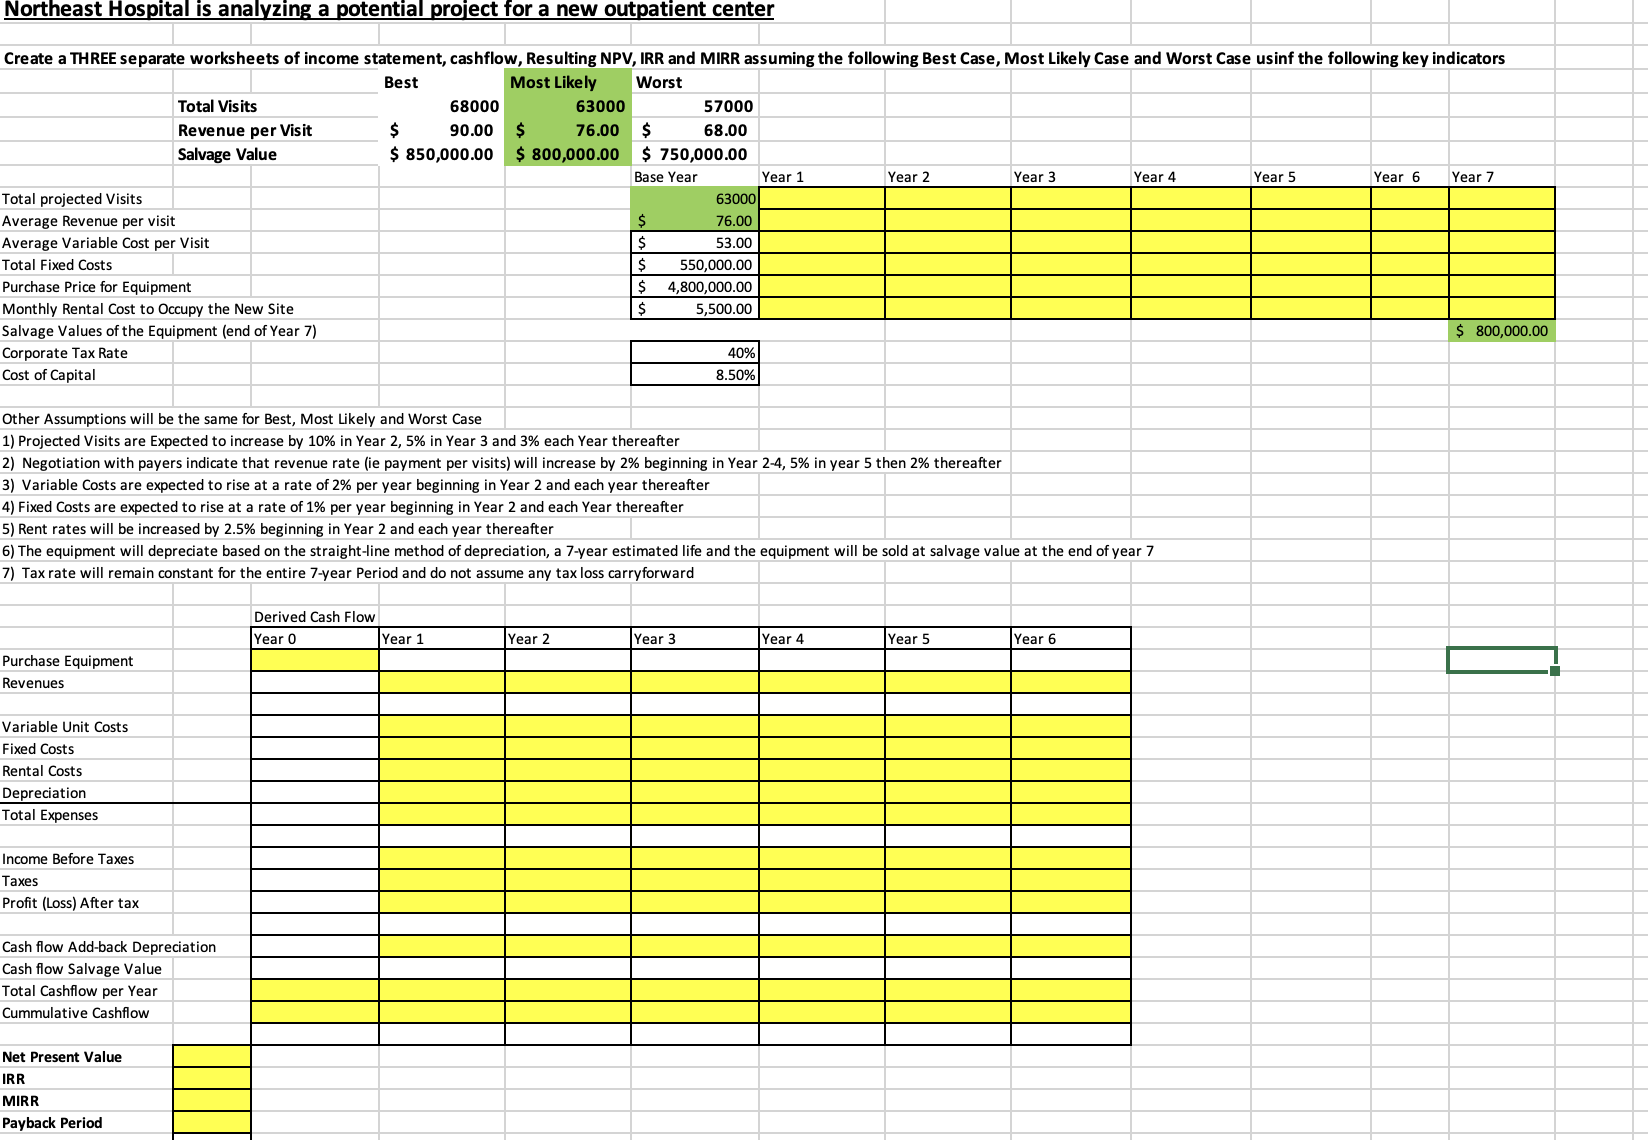
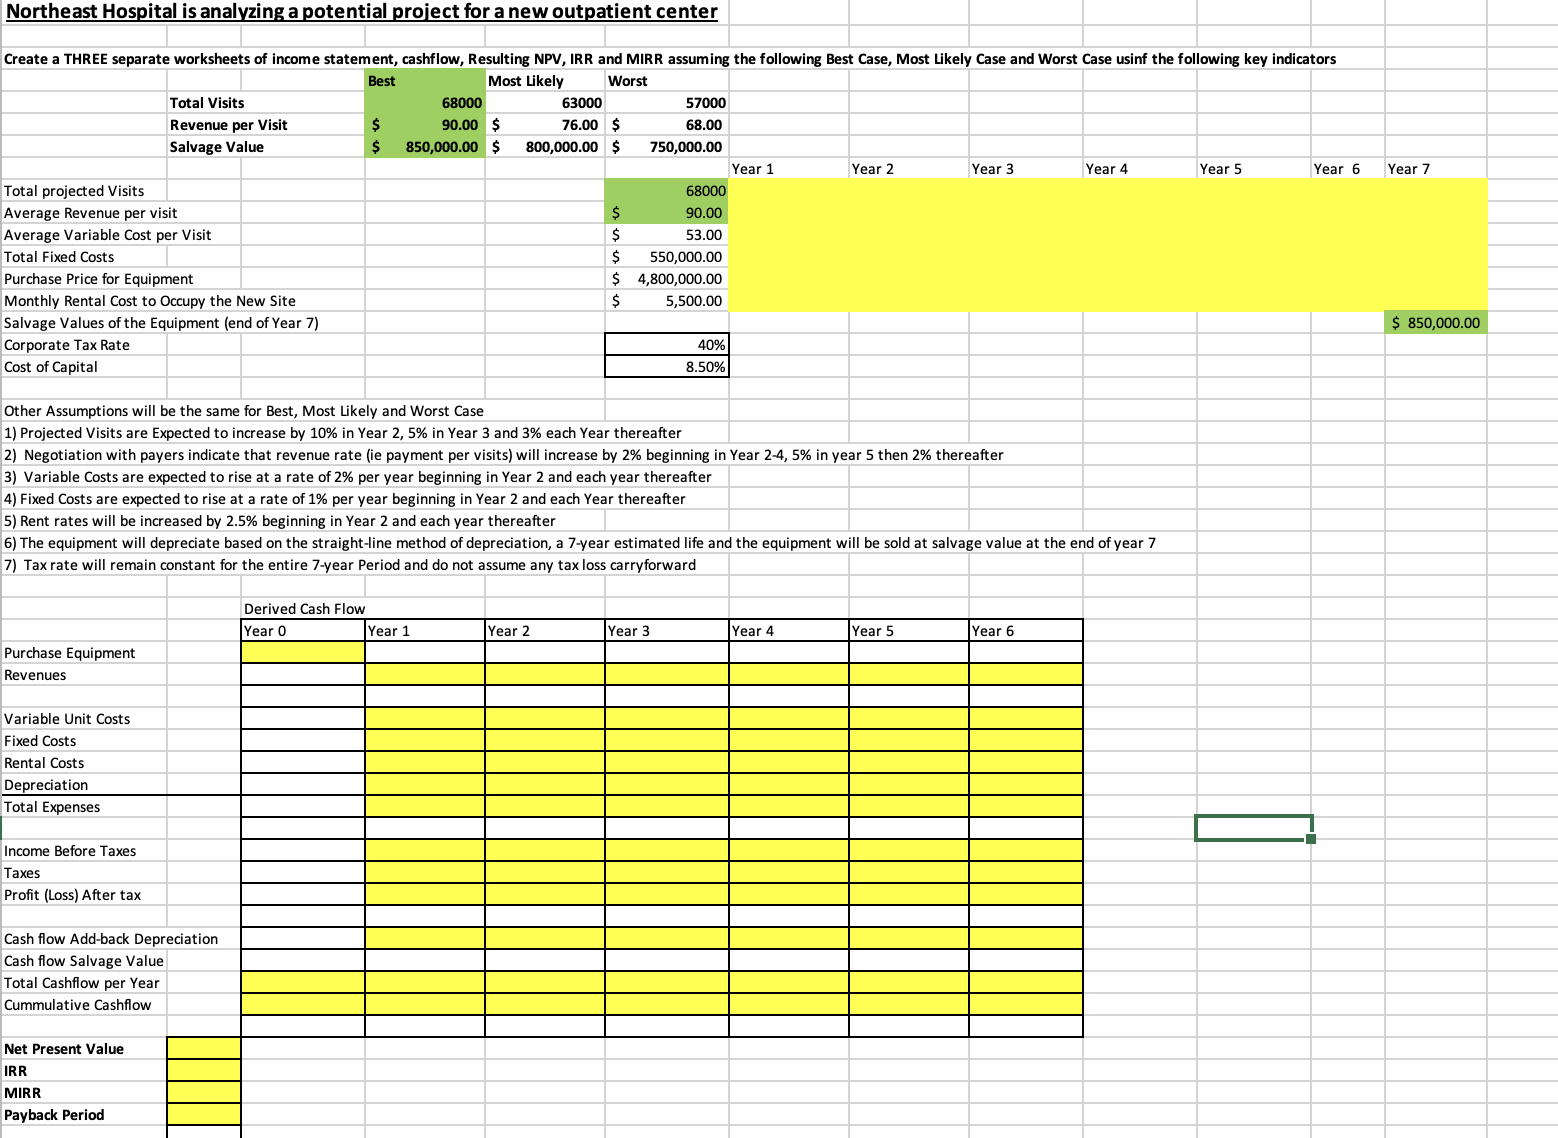
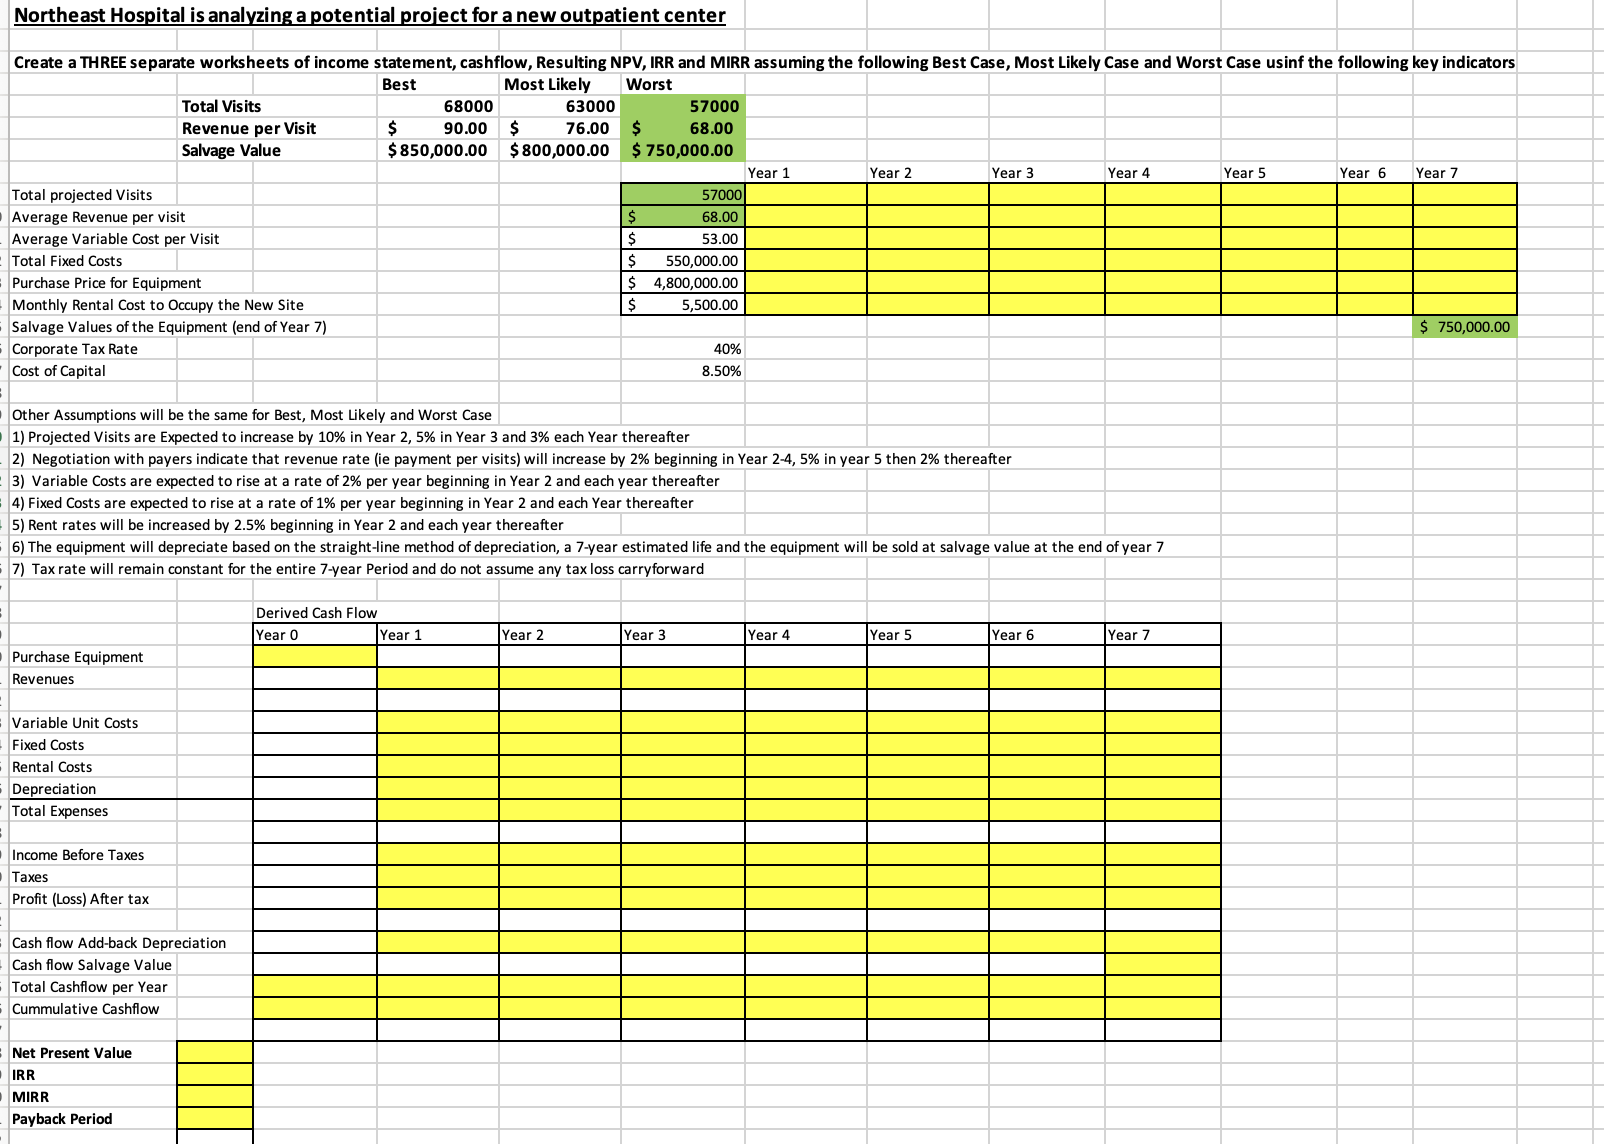
Northeast Hospital is analyzing a potential project for a new outpatient center Total Visits Revenue per Visit Salvage Value Total projected Visits Average Revenue per visit Average Variable Cost per Visit Total Fixed Costs Purchase Price for Equipment Monthly Rental Cost to Occupy the New Site Salvage Values of the Equipment (end of Year 7) Corporate Tax Rate Cost of Capital Best \begin{tabular}{llll|ll|} & 68000 & & 63000 & & 57000 \\ $ & 90.00 & $ & 76.00 & $ & 68.00 \end{tabular} $850,000.00$$00,000.00$750,000.00 Base Year Year 1 Year 2 Year 3 Year 4 Year 5 \begin{tabular}{|rr|} \hline$ & 63000 \\ \hline$ & 76.00 \\ \hline$ & 550,000.00 \\ \hline$ & 4,800,000.00 \\ \hline$ & 5,500.00 \\ \hline \end{tabular} \begin{tabular}{|r|} \hline 40% \\ \hline 8.50% \\ \hline \end{tabular} Other Assumptions will be the same for Best, Most Likely and Worst Case 1) Projected Visits are Expected to increase by 10% in Year 2, 5% in Year 3 and 3% each Year thereafter 2) Negotiation with payers indicate that revenue rate (ie payment per visits) will increase by 2% beginning in Year 24, 5% in year 5 then 2% thereafter 3) Variable Costs are expected to rise at a rate of 2% per year beginning in Year 2 and each year thereafter 4) Fixed Costs are expected to rise at a rate of 1% per year beginning in Year 2 and each Year thereafter 5) Rent rates will be increased by 2.5% beginning in Year 2 and each year thereafter 7) Tax rate will remain constant for the entire 7-year Period and do not assume any tax loss carryforward Purchase Equipment Revenues Variable Unit Costs Fixed Costs Rental Costs Depreciation Total Expenses Income Before Taxes Taxes Profit (Loss) After tax Cash flow Add-back Depreciation Cash flow Salvage Value Total Cashflow per Year Cummulative Cashflow Net Present Value IRR MIRR Payback Period Derived Cash Flow Year 6 Year 7 $800,000.00 \begin{tabular}{|l|l|} \hline \\ \hline \\ \hline \\ \hline \\ \hline \end{tabular} Northeast Hospital is analyzing a potential project for a new outpatient center Northeast Hospital is analyzing a potential project for a new outpatient center Create a THREE separate worksheets of income statement, cashflow, Resulting NPV, IRR and MIRR assuming the following Best Case, Most Likely Case and Worst Case usinf the following key indicators Starting with the solution file Most Likely Case Tab from Week 5 Excel Assignment and using the starting values for each variable, Create a Sensitivity Analysis to determine your Most Sensitive Variable of the three main variables: Number of Procedures, Average Revenue per Procedure and Salvage Value. Hint: YOU MUST keep all else constant and only adjust one level of one variable at a time, then you plot your NPV value from Cell c72 into the following table and the graph will automatically fill in for you
Step by Step Solution
There are 3 Steps involved in it

Get step-by-step solutions from verified subject matter experts