

Question: Moulton Industries has two potential projects for the coming year, Project B-12 and Project F-4. The two projects are mutually exclusive. The cash flows

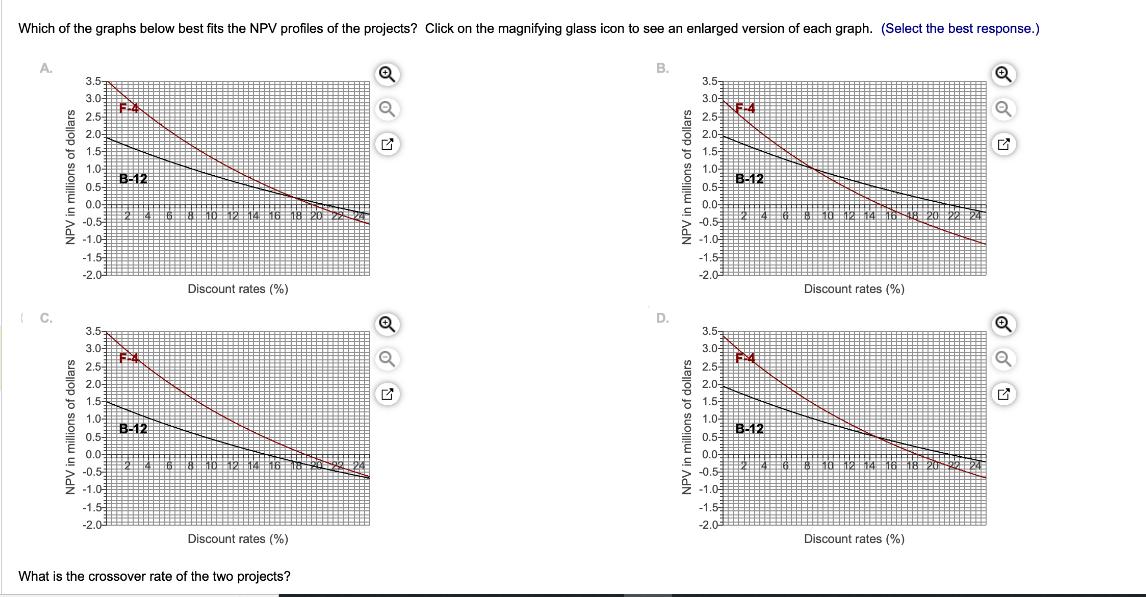
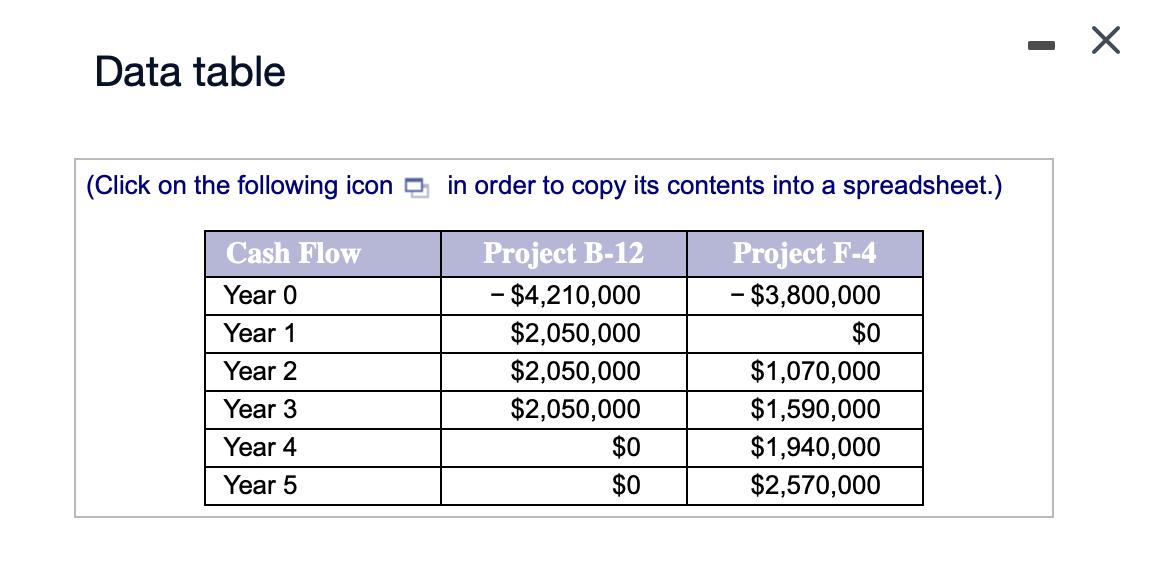
Moulton Industries has two potential projects for the coming year, Project B-12 and Project F-4. The two projects are mutually exclusive. The cash flows are listed in the following table: Draw the NPV profile of each project, and determine their crossover rate. If the appropriate hurdle rate is 8% for both projects, which project does Moulton Industries choose? Which of the graphs below best fits the NPV profiles of the projects? Click on the magnifying glass icon to see an enlarged version of each graph. (Select the best response.) A. C. 3.57 3.0 2.5 2.0 1.51 1.04 0.5- 0.0 -0.5 -1.03 -1.5- -2.0 3.5- 3.0 2.5-3 2.0 1.5 1.0 0.5- 0.0 -0.5- -1.03 -1.5 -2.0 F-4 B-12 F4 4 6 8 10 12 14 16 18 20 22 22- B-12 Discount rates (%) 4 6 8 10 12 14 16 Discount rates (%) What is the crossover rate of the two projects? 22-2 Q Q Q Q G B. D. 3.5- 3.0- 2.5- 2.0-3 1.5-5 1.05 0.5- 0.0- -0.5 -1.05 -1.52 -2.0 3.5- 3.0- 2.5 2.0- 1.5- 1.05 0.5- 0.03 -0.5 -1.03 -1.5- -2.0- F-4 B-12 2 4 6 8 10 12 14 16 18 20 22 24 F4 B-12 Discount rates (%) 2 4 6 8 10 12 14 16 18 Discount rates (%) Q Q Q Q G Data table (Click on the following icon in order to copy its contents into a spreadsheet.) Project B-12 Project F-4 - $3,800,000 - $4,210,000 $2,050,000 $0 $2,050,000 $1,070,000 $2,050,000 $1,590,000 $1,940,000 $2,570,000 Cash Flow Year 0 Year 1 Year 2 Year 3 Year 4 Year 5 $0 $0
Step by Step Solution
3.36 Rating (159 Votes )
There are 3 Steps involved in it
Net Present value is the difference between present value of cash inflows and cash outflows The exce... View full answer

Get step-by-step solutions from verified subject matter experts