

Question: Moving to another question will save this response. Moving to another question will save this response. Question 18 Q@Question 1 points Suppose the correlation between
Moving to another question will save this response.
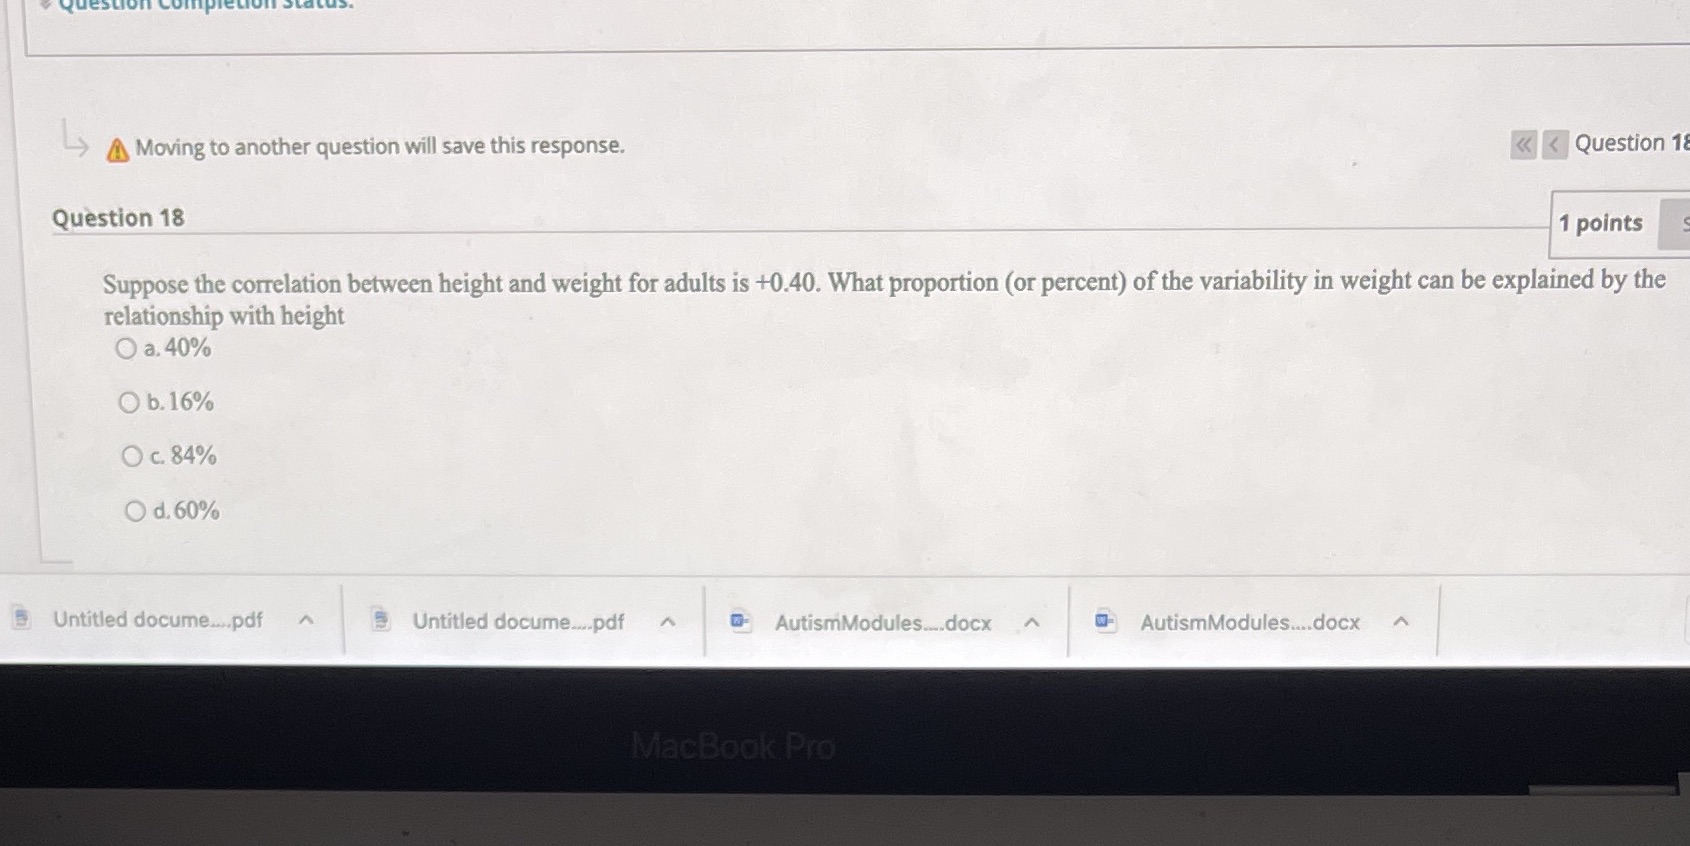
Moving to another question will save this response. Question 18 Q@Question 1 points Suppose the correlation between height and weight for adults is +0.40. What proportion (or percent) of the variability in weight can be explained by the relationship with height O c. 84% O d.600/0 Untitled docume..pdf Untitled docume . .pdf AutismModuIes.-.docx AutismModules....docx
Step by Step Solution
There are 3 Steps involved in it
1 Expert Approved Answer
Step: 1 Unlock

Question Has Been Solved by an Expert!
Get step-by-step solutions from verified subject matter experts
Step: 2 Unlock
Step: 3 Unlock