

Question: Moving to another question will save this response. Question 7 R (correlations) R Square Adj. R Square Observations 0.4327 .2138 0.2053 120 Coefficients p-value LCL
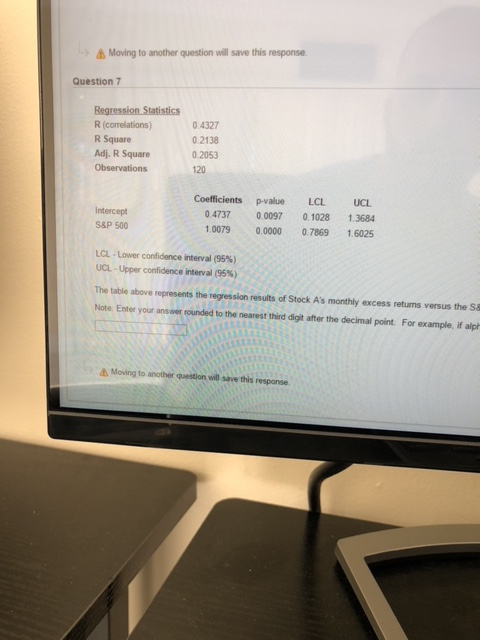
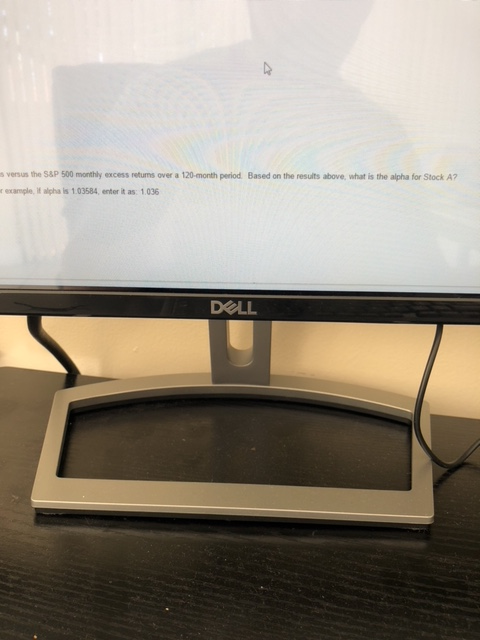
Moving to another question will save this response. Question 7 R (correlations) R Square Adj. R Square Observations 0.4327 .2138 0.2053 120 Coefficients p-value LCL UCL 0.4737 0.0097 0.1028 1.3684 1.0079 0.0000 0.7869 1.6025 Intercept S&P 500 LCL-Lower confidence interval (95%) UCL , Upper confidence interval (95%) The table above represents the regression results of Stock A's monthly excess retums versus the S Note. Enter your answer rounded to the nearest third digit after the decimal point. For example, if alp Moving to another question will save this response
Step by Step Solution
There are 3 Steps involved in it
1 Expert Approved Answer
Step: 1 Unlock

Question Has Been Solved by an Expert!
Get step-by-step solutions from verified subject matter experts
Step: 2 Unlock
Step: 3 Unlock