

Question: MR Methode ONly solve if you know answers edding Cost | Attendance 61700 300 52000 Sharon and Kim are two students who met in BUSS
MR Methode
ONly solve if you know answers
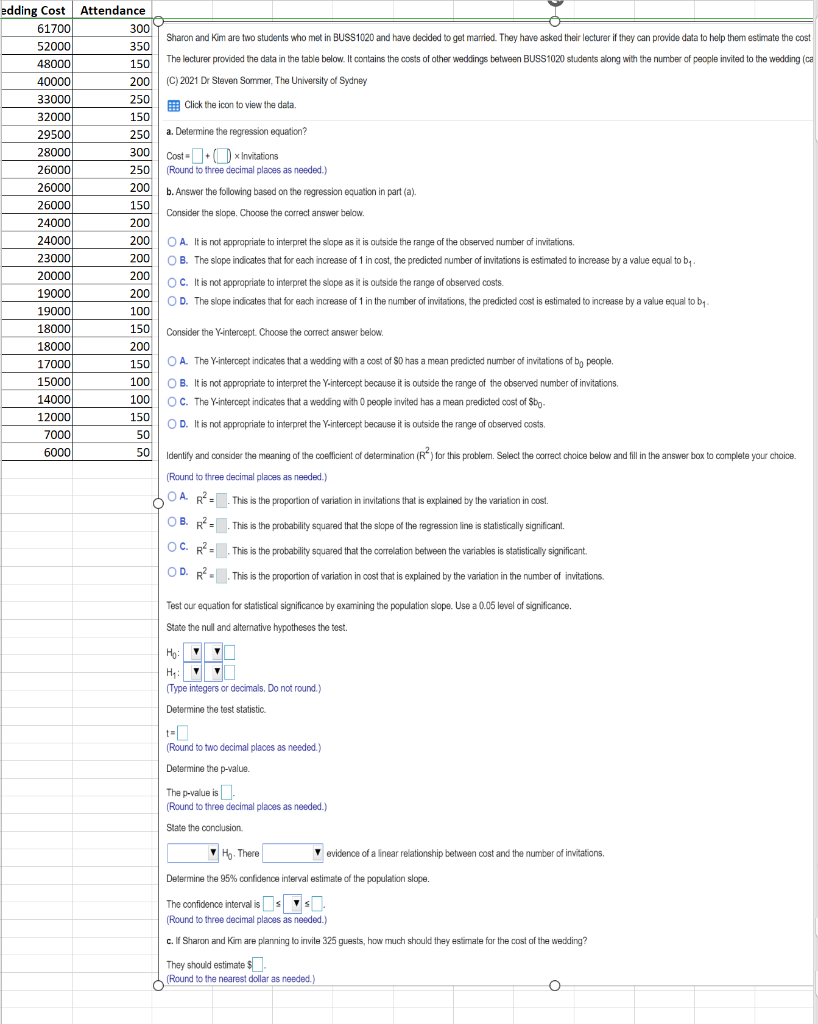
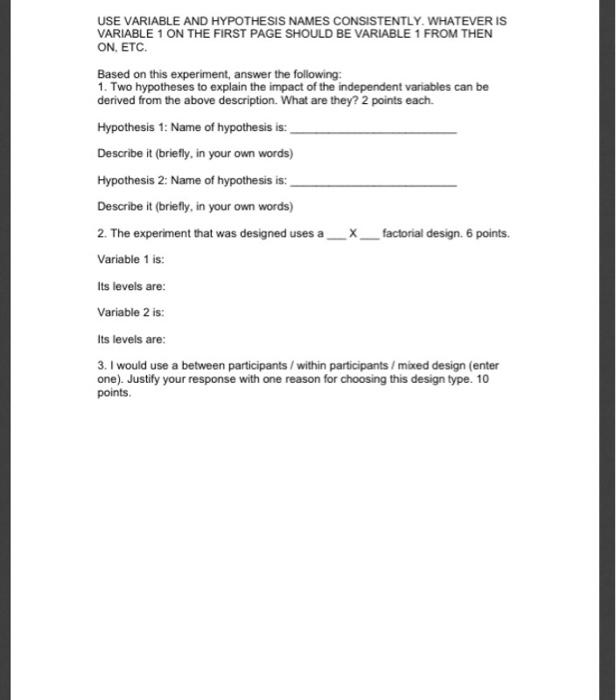
edding Cost | Attendance 61700 300 52000 Sharon and Kim are two students who met in BUSS 1020 and have decided to get married. They have asked their lecturer if they can provide data to help them estimate the cost 350 18000 150 The lecturer provided the data in the table below. It contains the costs of other weddings between BUSS1020 students along with the number of people invited to the wedding (ca 10000 200 (C) 2021 Dr Steven Sommer, The University of Sydney 33000 250 Click the icon to view the data. 32000 150 29500 250 a. Determine the regression equation? 28000 300 Cost =+ () * Invitations 26000 250 (Round to three decimal places as needed.) 26000 200 b. Answer the following based on the regression equation in part (a). 26000 150 Consider the slope. Choose the correct answer below. 24000 200 24000 200 O A. It is not appropriate to interpret the slope as it is outside the range of the observed number of invitations, 23000 200 O B. The slope indicates that for each increase of 1 in cost, the predicted number of invitations is estimated to increase by a value equal to by . 20000 200 O C. It is not appropriate to interpret the slope as it is outside the range of observed costs. 19000 200 O D. The slope indicates that for each increase of 1 in the number of invitations, the predicted cost is estimated to increase by a value equal to by- 19000 100 18000 150 Consider the Y-intercept. Choose the correct answer below. 18000 200 17000 150 O A. The Y-intercept indicates that a wedding with a cost of $0 has a mean predicted number of invitations of by people. 15000 100 O B. It is not appropriate to interpret the Y-intercept because it is outside the range of the observed number of invitations. 14000 100 O C. The Y-intercept indicates that a wedding with 0 people invited has a mean predicted cost of Shop- 12000 150 O D. It is not appropriate to interpret the Y-intercept because it is outside the range of observed costs. 7000 50 6000 50 Identify and consider the meaning of the coefficient of determination (R") for this problem. Select the correct choice below and fill in the answer box to complete your choice. Round to three decimal places as needed.) O A R" =. This is the proportion of variation in invitations that is explained by the variation in cost. O B. R? = . This is the probability squared that the slope of the regression line is statistically significant. O C. R? =. This is the probability squared that the correlation between the variables is statistically significant. O D. R? = . This is the proportion of variation in cost that is explained by the variation in the number of invitations. Test our equation for statistical significance by examining the population slope. Use a 0.05 level of significance. State the null and alternative hypotheses the test. (Type integers or decimals. Do not round.) Determine the test statistic t= (Round to two decimal places as needed.) Determine the p-value. The p-value is. (Round to three decimal places as needed.) State the conclusion. Ho. There evidence of a linear relationship between cost and the number of invitations, Determine the 95% confidence interval estimate of the population slope. The confidence interval is s s. (Round to three decimal places as needed.) c. If Sharon and Kim are planning to invite 325 guests, how much should they estimate for the cost of the wedding? They should estimate $ (Round to the nearest dollar as needed.) OUSE VARIABLE AND HYPOTHESIS NAMES CONSISTENTLY. WHATEVER IS VARIABLE 1 ON THE FIRST PAGE SHOULD BE VARIABLE 1 FROM THEN ON, ETC. Based on this experiment, answer the following: 1. Two hypotheses to explain the impact of the independent variables can be derived from the above description. What are they? 2 points each. Hypothesis 1: Name of hypothesis is: Describe it (briefly, in your own words) Hypothesis 2: Name of hypothesis is: Describe it (briefly, in your own words) 2. The experiment that was designed uses a _X_factorial design. 6 points. Variable 1 is: Its levels are: Variable 2 is: Its levels are: 3. I would use a between participants / within participants / mixed design (enter one). Justify your response with one reason for choosing this design type. 10 points
Step by Step Solution
There are 3 Steps involved in it

Get step-by-step solutions from verified subject matter experts