

Question: MR NA MC NA Using the table for a monopoly firm, Price (S) Q (Demand) TR TC 16 0 10 15 1 13 14 2.
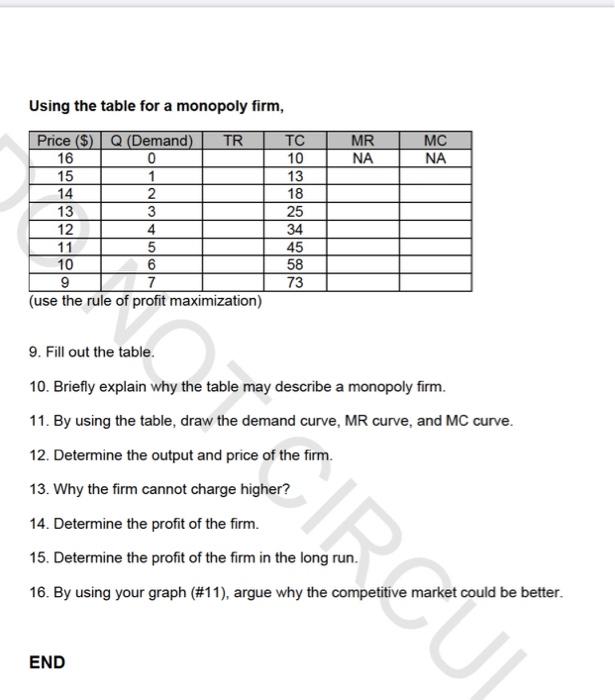
MR NA MC NA Using the table for a monopoly firm, Price (S) Q (Demand) TR TC 16 0 10 15 1 13 14 2. 18 13 3 25 12 4 34 11 5 45 10 6 58 9 7 73 (use the rule of profit maximization) 9. Fill out the table. 10. Briefly explain why the table may describe a monopoly firm. 11. By using the table, draw the demand curve, MR curve, and MC curve. 12. Determine the output and price of the firm. 13. Why the firm cannot charge higher? 14. Determine the profit of the firm. 15. Determine the profit of the firm in the long run. 16. By using your graph (#11), argue why the competitive market could be better. END
Step by Step Solution
There are 3 Steps involved in it
1 Expert Approved Answer
Step: 1 Unlock

Question Has Been Solved by an Expert!
Get step-by-step solutions from verified subject matter experts
Step: 2 Unlock
Step: 3 Unlock