

Question: MTH 141 Data Analysis Paper For a population of values,x,there is a probability distribution of the values. If y = f (x)is the probability distribution

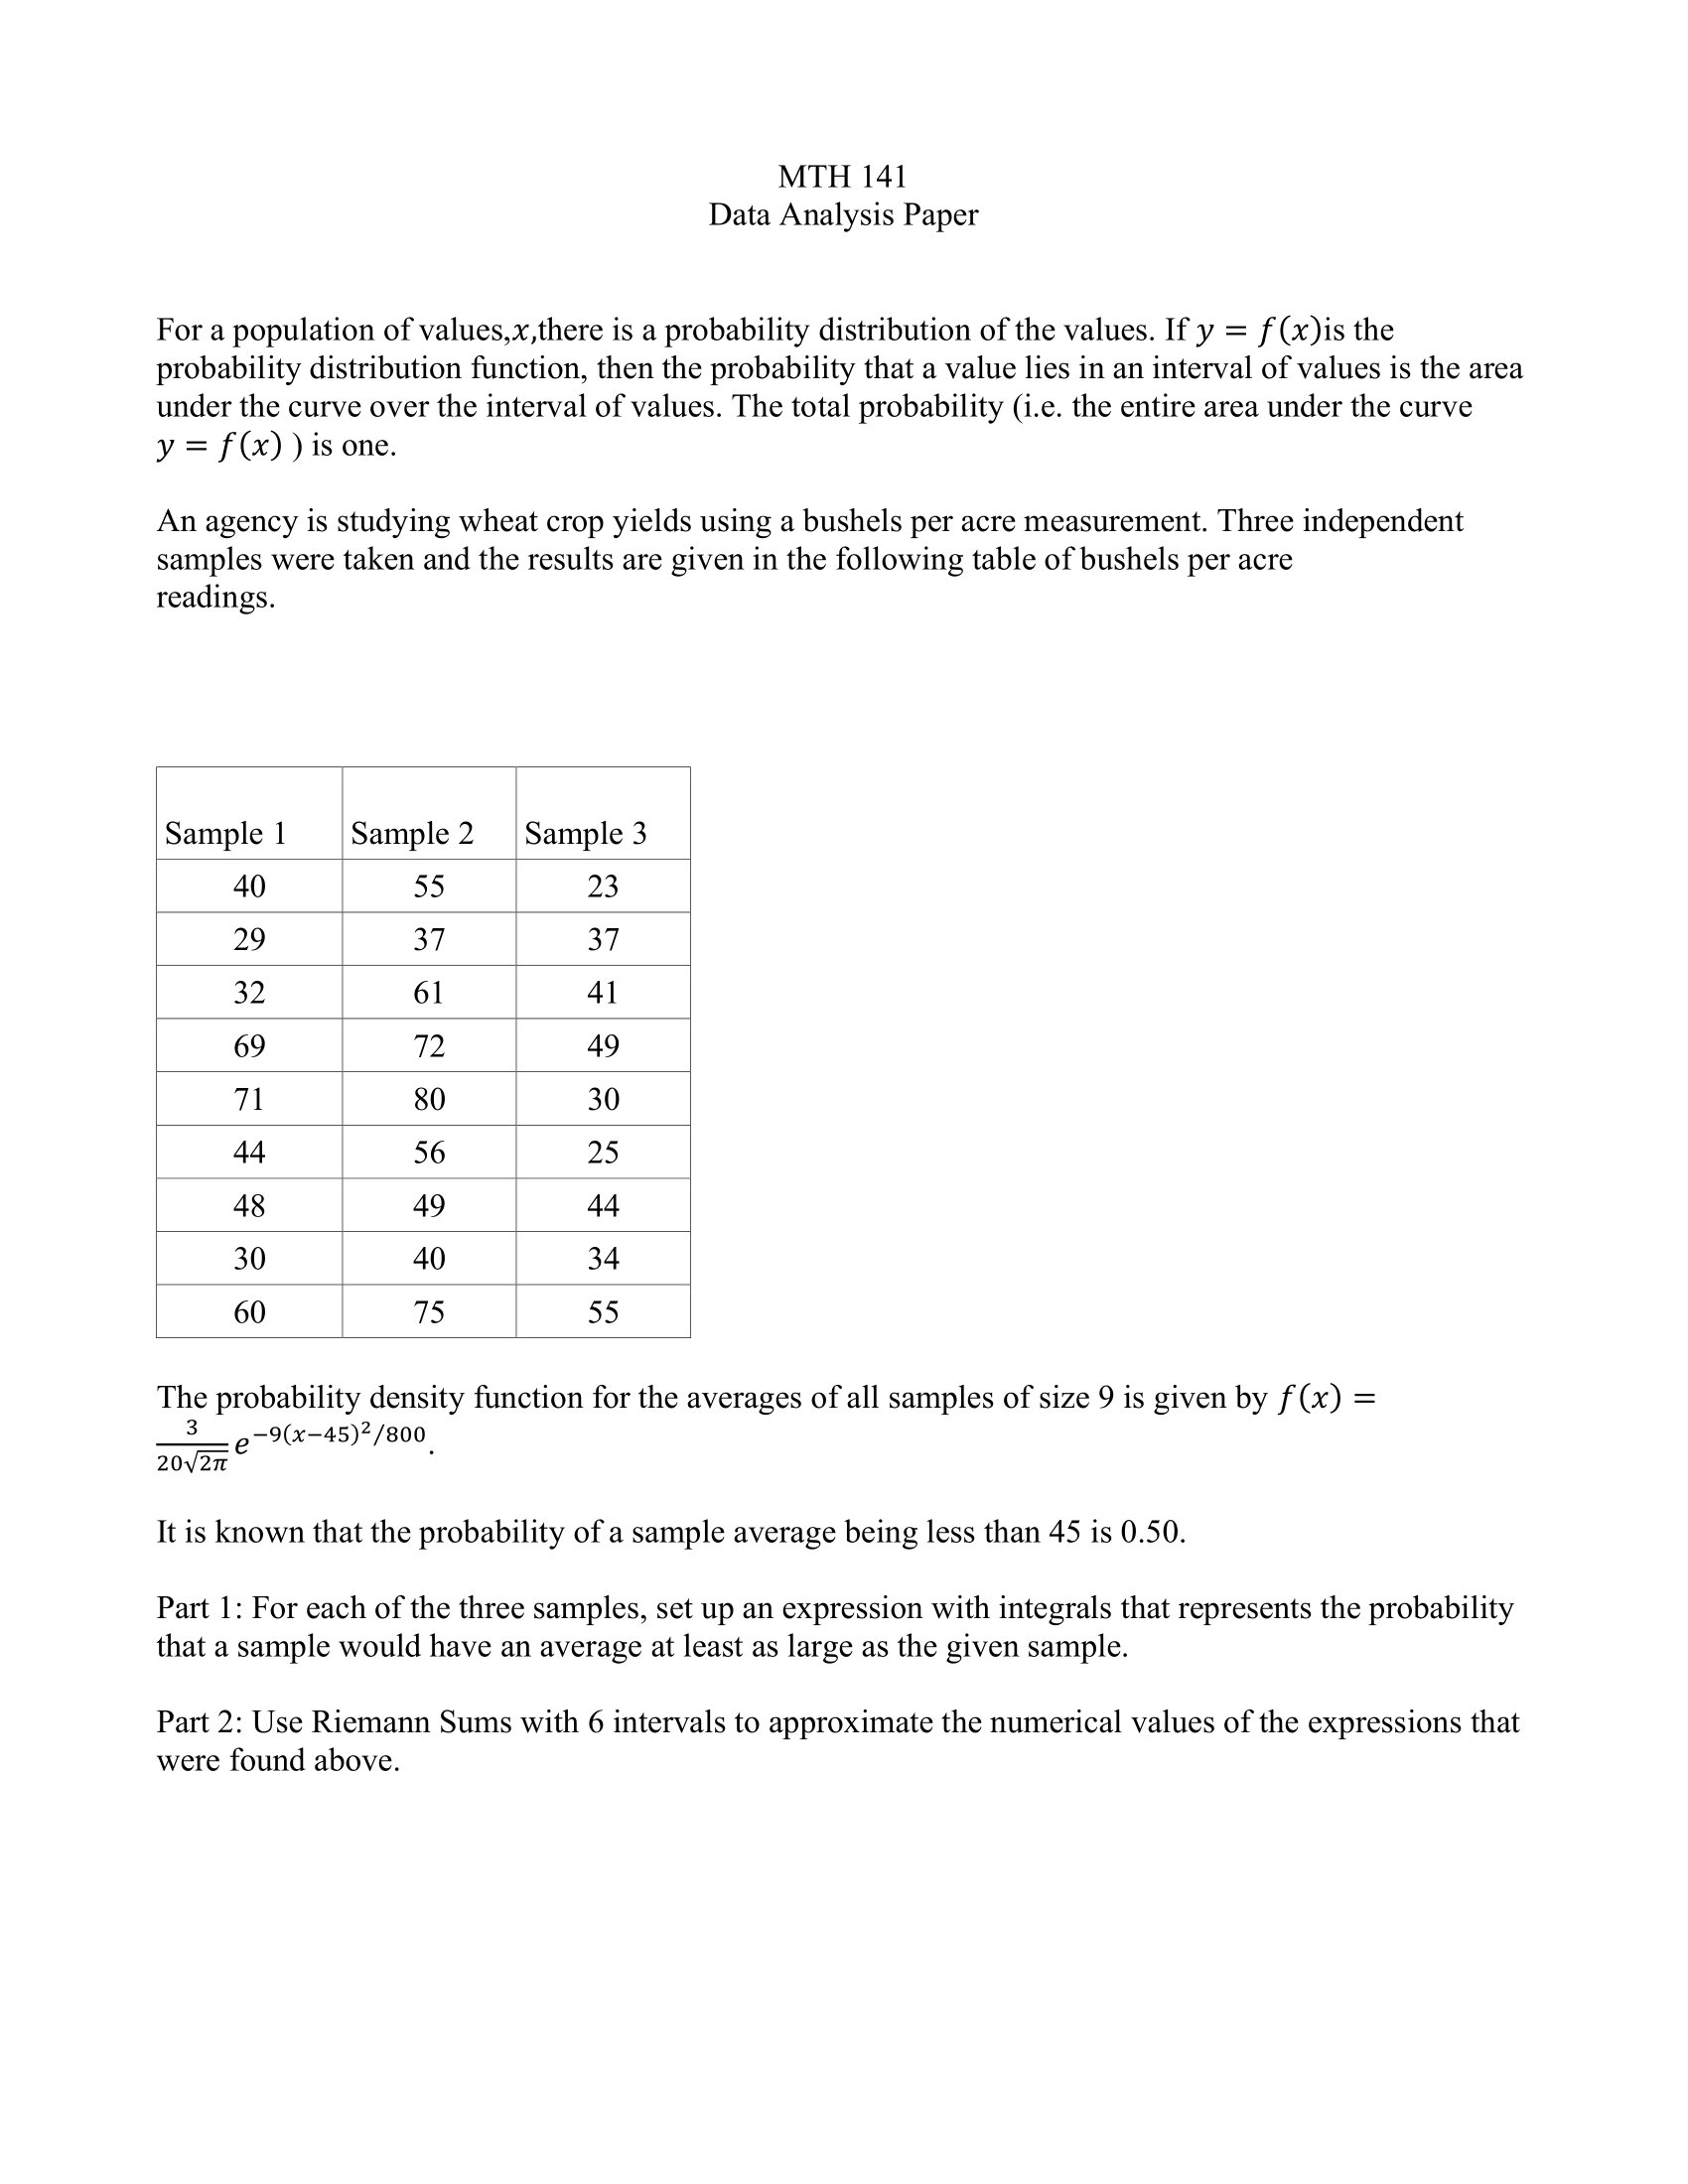
MTH 141 Data Analysis Paper For a population of values,x,there is a probability distribution of the values. If y = f (x)is the probability distribution function, then the probability that a value lies in an interval of values is the area under the curve over the interval of values. The total probability (i.e. the entire area under the curve y = f(x) ) is one. An agency is studying wheat crop yields using 21 bushels per acre measurement. Three independent samples were taken and the results are given in the following table of bushels per acre readings. Sample 1 Sample 2 Sample 3 40 55 23 29 I 37 I 37 32 61 41 69 I 72 I 49 71 so 30 44 56 25 48 I 49 I 44 30 40 34 60 i 75 i 55 The probability density function for the averages of all samples of size 9 is given by f (x) = 3 79(xi45)2/800' 8 ZOVZH It is known that the probability of a sample average being less than 45 is 0.50. Part 1: For each of the three samples, set up an expression with integrals that represents the probability that a sample would have an average at least as large as the given sample. Part 2: Use Riemann Sums with 6 intervals to approximate the numerical values of the expressions that were found above
Step by Step Solution
There are 3 Steps involved in it

Get step-by-step solutions from verified subject matter experts