

Mugs Inc. operates a chain of lunch shops. The company is considering two possible expansion plans....
Fantastic news! We've Found the answer you've been seeking!
Question:

Transcribed Image Text:
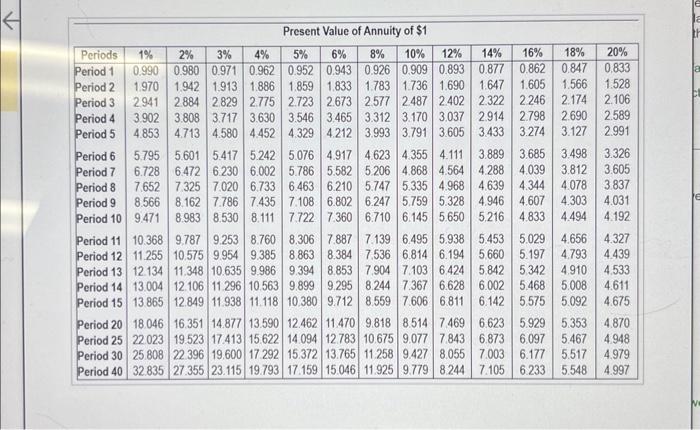
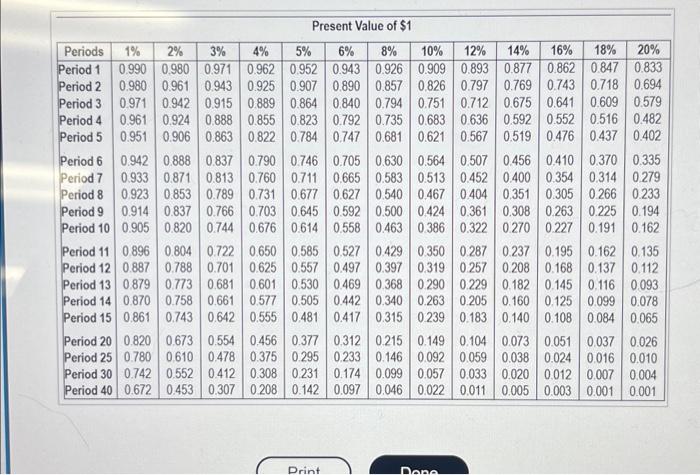
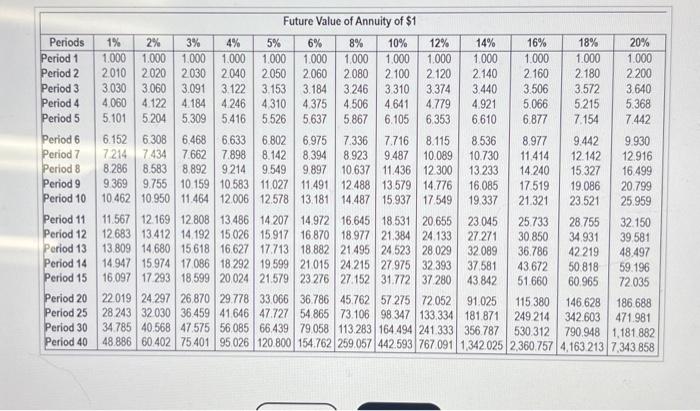
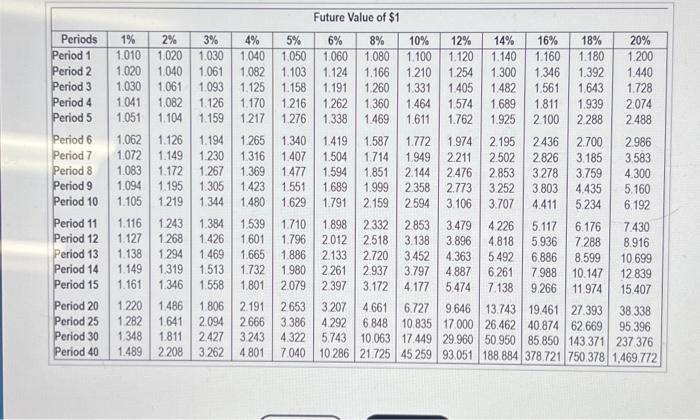
Mugs Inc. operates a chain of lunch shops. The company is considering two possible expansion plans. Plan A would open eight smaller shops at a cost of $8,940,000. Expected annual net cash inflows are $1,550,000 with zero residual value at the end of ten years. Under Plan B, Mugs would open three larger shops at a cost of $8,840,000. This plan is expected to generate net cash inflows of $1,100,000 per year for ten years, the estimated life of the properties. Estimated residual value is $1,050,000. Mugs uses straight-line depreciation and requires an annual return of 6%. (Click the icon to view the present value annuity factor table.) (Click the icon to view the present value factor table.) (Click the icon to view the future value factor table.) (Click the icon to view the future value annuity factor table.) Read the requirements Requirement 1. Compute the payback period, the ARR, and the NPV of these two plans. What are the strengths and weaknesses of these capital budgeting models? Begin by computing the payback period for both plans. (Round your answers to one decimal place.) Plan A (in years) Plan B (in years) Now compute the ARR (accounting rate of return) for both plans. (Round the percentages to the nearest tenth percent.). Plan A Plan B % Next compute the NPV (net present value) under each plan. Begin with Plan A, then compute Plan B. (Round your answers to the nearest whole dollar and use parentheses or a minus sign to represent a negative NPV) Net present value of Plan A 18% 20% Periods 1% Period 1 0.990 0.833 Period 2 1.970 1.528 Period 3 2.941 Period 4 Period 5 2.991 Present Value of Annuity of $1 2% 3% 4% 5% 6% 8% 10% 12% 14% 16% 0.980 0.971 0.962 0.952 0.943 0.926 0.909 0.893 0.877 0.862 0.847 1,942 1.913 1.886 1.859 1.833 1.783 1.736 1.690 1.647 1.605 1.566 2884 2.829 2.775 2.723 2.673 2.577 2.487 2.402 2.322 2.246 2.174 2.106 3.902 3.808 3.717 3.630 3.546 3.465 3.312 3.170 3,037 2.914 2.798 2.690 2.589 4.853 4.713 4.580 4.452 4.329 4.212 3.993 3.791 3.605 3.433 3.274 3.127 5.795 5.601 5.417 5.242 5.076 4.917 4.623 4.355 4.111 3.889 3.685 3.498 3.326 6.728 6.472 6.230 6.002 5.786 5.582 5.206 4.868 4.564 4.288 4.039 3.812 3.605 7.652 7.325 7.020 6.733 6.463 6.210 5.747 5.335 4.968 4.639 4.344 4.078 8.566 8.162 7.786 7.435 7.108 6.802 6.247 5.759 5.328 4.946 4.607 4.303 9.471 8.983 8.530 8.111 7.722 7.360 6.710 6.145 5.650 5,216 4.833 4.494 9,787 9.253 8.760 8.306 7.887 7.139 6.495 5.938 5.453 5.029 4.656 10.575 9.954 9.385 8.863 8.384 7.536 6.814 6.194 5.660 5.197 4.793 11.348 10.635 9.986 9.394 8.853 7.904 7.103 6.424 5.842 5,342 4.910 12.106 11.296 10.563 9.899 9.295 8.244 7.367 6.628 6.002 5.468 5.008 13.865 12.849 11.938 11.118 10.380 9.712 8.559 7.606 6.811 6.142 5.575 5.092 3.837 Period 11 10.368 11.255 Period 12 Period 13 12 134 13.004 Period 14 Period 15 Period 6 Period 7 Period 8 Period 9 Period 10 Period 20 18.046 16.351 14.877 13.590 12.462 11.470 9.818 8.514 7.469 6.623 5.929 5.353 Period 25 22.023 19.523 17.413 15.622 14.094 12.783 10.675 9.077 7.843 6.873 6.097 5.467 Period 30 25.808 22 396 19,600 17.292 15.372 13.765 11.258 9.427 8.055 7.003 6.177 5.517 Period 40 32.835 27.355 23.115 19.793 17.159 15.046 11.925 9.779 8.244 7.105 6.233 5.548 4.031 4.192 4.327 4.439 4.533 4.611 4.675 4.870 4948 4.979 4.997 Present Value of $1 4% Periods 1% 2% 3% 5% Period 1 0.990 0,980 0.971 0.962 0.952 0.980 0.961 0.943 0.925 0.907 6% 8% 10% 12% 14% 16% 18% 20% 0.943 0.926 0.909 0.893 0.877 0.862 0.847 0.833 0.890 0.857 0.826 0.797 0.769 0.743 0.718 0.694 Period 2 Period 3 0.971 0.942 Period 4 0.915 0.889 0.864 0.840 0.794 0.751 0.712 0.675 0.641 0.609 0.579 0.961 0.924 0.888 0.855 0.823 0.792 0.735 0.683 0.636 0.592 0.552 0.516 0.482 0.951 0.906 0.863 0.822 0.784 0.747 0.681 0.621 0.567 Period 5 0.519 0.476 0.437 0.402 Period 6 Period 7 0.942 0.888 0.837 0.790 0.746 0.705 0.630 0.564 0.507 0.933 0.871 0.813 0.760 0.711 0.665 0.583 0.513 0.452 Period 8 0.923 0.853 0.789 0.731 0.677 0.627 0.540 0.467 0.404 0.351 Period 9 0.914 0.837 0.766 0.703 0.645 0.592 0.500 0.424 0.361 0.308 Period 10 0.905 0.820 0.744 0.676 0.614 0.558 0.463 0.386 0.322 0.270 Period 11 0.896 0.804 0.722 0.650 0.585 0.527 0.429 Period 12 0.887 0.788 0.701 0.625 0.557 0.497 0.397 Period 13 0.879 0.773 0.681 0.601 0.530 0.469 0.368 Period 14 0.870 0.758 0.661 0.577 0.505 0.442 0.340 Period 15 0.861 0.743 0.642 0.555 0.481 0.417 0.315 Period 20 Period 25 Period 30 Period 40 0.820 0.780 0.742 0.673 0.554 0.456 0.377 0.312 0.215 0.149 0.104 0.073 0.051 0.037 0.026 0.610 0.478 0.375 0.295 0.233 0.146 0.092 0.059 0.038 0.024 0.016 0.010 0.552 0.412 0.308 0.231 0.174 0.099 0.057 0.033 0.020 0.012 0.007 0.004 0.672 0.453 0.307 0.208 0.142 0.097 0.046 0.022 0.011 0.005 0.003 0.001 0.001 Print 0.456 0.410 0.370 0.335 0.400 0.354 0.314 0.279 0.305 0.266 0.233 0.263 0.225 0.194 0.227 0.191 0.162 0.350 0.287 0.237 0.195 0.162 0.135 0.319 0.257 0.208 0.168 0.137 0.112 0.290 0.229 0.182 0.145 0.116 0.093 0.263 0.205 0.160 0.125 0.099 0.078 0.239 0.183 0.140 0.108 0.084 0.065 Done Future Value of Annuity of $1 3.374 3.440 Periods 1% 2% 3% 4% 5% 6% 8% 10% 12% Period 1 1.000 1.000 1.000 1.000 1.000 1.000 1,000 1,000 1.000 Period 2 2010 2020 2.030 2040 2.050 2.060 2.080 2.100 2.120 2.140 Period 3 3.030 3.060 3.091 3.122 3.153 3.184 3.246 3.310 4,060 4.122 4.184 4.246 4.310 4.375 4.506 4.641 4.779 5.416 5.526 5.637 5.867 6.975 7.336 8.536 8.394 8.923 9.487 10.089 10.730 9.897 10.637 11.436 12.300 13.233 Period 4 Period 5 5.101 5.204 5.309 6.105 6.353 7.716 8.115 6.152 6.308 6.468 6.633 6.802 7.214 7.434 7.662 7.898 8.142 8.286 8.583 8.892 9214 9.549 9.369 9.755 10.159 10.583 11.027 11.491 10.462 10.950 11.464 12.006 12.578 13.181 Period 6 Period 7 Period 8 Period 9 Period 10 Period 11 Period 12 Period 13 Period 14 Period 15 Period 20 Period 25 Period 30 Period 40 14% 1.000 16% 1.000 2.160 3.506 4.921 5.066 6.610 6.877 18% 1.000 2.180 3.572 5.215 7.154 20% 1.000 2.200 3.640 5.368 7.442 8.977 9.442 9.930 11.414 12.142 12.916 16.499 20.799 25.959 32.150 39.581 14.240 15.327 12.488 13.579 14.776 16.085 17.519 19.086 14.487 15.937 17.549 19.337 21.321 23.521 11.567 12.169 12.808 13.486 14.207 14.972 16.645 18.531 20.655 23.045 25.733 28.755 12.683 13.412 14,192 15.026 15.917 16.870 18.977 21.384 24.133 27.271 30.850 34.931 13.809 14.680 15.618 16.627 17.713 18.882 21 495 24.523 28.029 32.089 36.786 42219 48.497 14.947 15.974 17.086 18.292 19.599 21.015 24.215 27.975 32.393 37,581 16.097 17.293 18.599 20.024 21.579 23 276 27.152 31.772 37.280 43.842 22.019 24.297 26.870 29.778 33.066 36.786 45.762 57 275 72.052 91.025 115.380 146.628 186.688 28 243 32 030 36.459 41.646 47.727 54.865 73.106 98.347 133,334 181.871 249.214 342.603 471.981 34.785 40.568 47.575 56.085 66.439 79.058 113.283 164 494 241.333 356.787 530.312 790.948 1,181.882 48.886 60 402 75.401 95.026 120.800 154.762 259.057 442.593 767.091 1,342.025 2,360.757 4,163.213 7,343.858 59.196 72.035 43.672 50.818 51.660 60.965 Periods 1% Period 1 Period 2 Period 3 Period 4 Period 5 Period 6 Period 7 Period 8 Period 9. Period 10 Period 11 Period 12 Period 13 Period 14 Period 15 Period 20 Period 25 2% 3% 4% 1.010 1.020 1.030 1.040 1.020 1.040 1.061 1.082 1.030 1.061 1.093 1.125 1.041 1.082 1.051 Period 30 Period 40 1.126 1.170 1.104 1.159 1.217 1.062 1.126 1.194 1.265 1.072 1.149 1.230 1.316 1.083 1.172 1.267 1.369 1.094 1.195 1.305 1.423 1.105 1.219 1.344 1.480 1.116 1.243 1.127 1.138 1.149 1.161 1.384 1.539 1.710 1.898 2.332 1.268 1.426 1.601 1.796 2012 2.518 1.886 2.133 2.720 1.980 2.261 2.937 1.558 1.801 2.079 2.397 3.172 1.294 1.469 1.665 1.319 1.513 1.732 1.346 1.220 1.486 1.282 1.641 1,348 1.811 1.489 2.208 Future Value of $1 5% 1.050 1.060 6% 8% 10% 12% 1.080 1.100 1.120 1.103 1.124 1.166 1.210 1.254 1.158 1.191 1.260 1.331 1.360 1.464 1.469 1.611 1.216 1.262 1.276 1.338 1.806 2.191 2.094 2.427 1.340 1.419 1.587 1.772 1.974 2.195 2436 1.407 1.504 1.714 1.949 2.211 2.502 2.826 3.185 1.851 2.144 2.476 2.853 3.278 3.759 1.477 1.594 1.551 1.689 1.999 2.358 2.773 3.252 3.803 4.435 1.791 2.159 2.594 3.106 1.629 3.707 4.411 5.234 2.653 3.207 2.666 3.386 3.243 3.262 4.801 7.040 14% 16% 18% 1.140 1.160 1.180 1.300 1.405 1.482 1.561 1.643 1.346 1.392 1.574 1.689 1.811 1.939 1.762 1.925 2.100 2.288 4.322 5.743 20% 1.200 1.440 1.728 2.074 2.488 2.700 2.986 3.583 4.300 5.160 6.192 38.338 4.661 6.727 4.292 6.848 10.835 9.646 13.743 19.461 27.393 17.000 26.462 40.874 62.669 95.396 10.063 17 449 29.960 50.950 85.850 143.371 237.376 10 286 21.725 45.259 93.051 188.884 378.721 750 378 1,469.772 6.176 7.430 2.853 3.479 4.226 5.117 3.138 3.896 4.818 3.452 4.363 5.492 5.936 7.288 8.916 6.886 8.599 10.699 3.797 4.887 6.261 7.988 10.147 12.839 4.177 5.474 7.138 9.266 11.974 15.407 1. Compute the payback period, the ARR, and the NPV of these two plans. What are the strengths and weaknesses of these capital budgeting models? 2. Which expansion plan should Mugs choose? Why? 3. Estimate Plan A's IRR. How does the IRR compare with the company's required rate of return? Mugs Inc. operates a chain of lunch shops. The company is considering two possible expansion plans. Plan A would open eight smaller shops at a cost of $8,940,000. Expected annual net cash inflows are $1,550,000 with zero residual value at the end of ten years. Under Plan B, Mugs would open three larger shops at a cost of $8,840,000. This plan is expected to generate net cash inflows of $1,100,000 per year for ten years, the estimated life of the properties. Estimated residual value is $1,050,000. Mugs uses straight-line depreciation and requires an annual return of 6%. (Click the icon to view the present value annuity factor table.) (Click the icon to view the present value factor table.) (Click the icon to view the future value factor table.) (Click the icon to view the future value annuity factor table.) Read the requirements Requirement 1. Compute the payback period, the ARR, and the NPV of these two plans. What are the strengths and weaknesses of these capital budgeting models? Begin by computing the payback period for both plans. (Round your answers to one decimal place.) Plan A (in years) Plan B (in years) Now compute the ARR (accounting rate of return) for both plans. (Round the percentages to the nearest tenth percent.). Plan A Plan B % Next compute the NPV (net present value) under each plan. Begin with Plan A, then compute Plan B. (Round your answers to the nearest whole dollar and use parentheses or a minus sign to represent a negative NPV) Net present value of Plan A 18% 20% Periods 1% Period 1 0.990 0.833 Period 2 1.970 1.528 Period 3 2.941 Period 4 Period 5 2.991 Present Value of Annuity of $1 2% 3% 4% 5% 6% 8% 10% 12% 14% 16% 0.980 0.971 0.962 0.952 0.943 0.926 0.909 0.893 0.877 0.862 0.847 1,942 1.913 1.886 1.859 1.833 1.783 1.736 1.690 1.647 1.605 1.566 2884 2.829 2.775 2.723 2.673 2.577 2.487 2.402 2.322 2.246 2.174 2.106 3.902 3.808 3.717 3.630 3.546 3.465 3.312 3.170 3,037 2.914 2.798 2.690 2.589 4.853 4.713 4.580 4.452 4.329 4.212 3.993 3.791 3.605 3.433 3.274 3.127 5.795 5.601 5.417 5.242 5.076 4.917 4.623 4.355 4.111 3.889 3.685 3.498 3.326 6.728 6.472 6.230 6.002 5.786 5.582 5.206 4.868 4.564 4.288 4.039 3.812 3.605 7.652 7.325 7.020 6.733 6.463 6.210 5.747 5.335 4.968 4.639 4.344 4.078 8.566 8.162 7.786 7.435 7.108 6.802 6.247 5.759 5.328 4.946 4.607 4.303 9.471 8.983 8.530 8.111 7.722 7.360 6.710 6.145 5.650 5,216 4.833 4.494 9,787 9.253 8.760 8.306 7.887 7.139 6.495 5.938 5.453 5.029 4.656 10.575 9.954 9.385 8.863 8.384 7.536 6.814 6.194 5.660 5.197 4.793 11.348 10.635 9.986 9.394 8.853 7.904 7.103 6.424 5.842 5,342 4.910 12.106 11.296 10.563 9.899 9.295 8.244 7.367 6.628 6.002 5.468 5.008 13.865 12.849 11.938 11.118 10.380 9.712 8.559 7.606 6.811 6.142 5.575 5.092 3.837 Period 11 10.368 11.255 Period 12 Period 13 12 134 13.004 Period 14 Period 15 Period 6 Period 7 Period 8 Period 9 Period 10 Period 20 18.046 16.351 14.877 13.590 12.462 11.470 9.818 8.514 7.469 6.623 5.929 5.353 Period 25 22.023 19.523 17.413 15.622 14.094 12.783 10.675 9.077 7.843 6.873 6.097 5.467 Period 30 25.808 22 396 19,600 17.292 15.372 13.765 11.258 9.427 8.055 7.003 6.177 5.517 Period 40 32.835 27.355 23.115 19.793 17.159 15.046 11.925 9.779 8.244 7.105 6.233 5.548 4.031 4.192 4.327 4.439 4.533 4.611 4.675 4.870 4948 4.979 4.997 Present Value of $1 4% Periods 1% 2% 3% 5% Period 1 0.990 0,980 0.971 0.962 0.952 0.980 0.961 0.943 0.925 0.907 6% 8% 10% 12% 14% 16% 18% 20% 0.943 0.926 0.909 0.893 0.877 0.862 0.847 0.833 0.890 0.857 0.826 0.797 0.769 0.743 0.718 0.694 Period 2 Period 3 0.971 0.942 Period 4 0.915 0.889 0.864 0.840 0.794 0.751 0.712 0.675 0.641 0.609 0.579 0.961 0.924 0.888 0.855 0.823 0.792 0.735 0.683 0.636 0.592 0.552 0.516 0.482 0.951 0.906 0.863 0.822 0.784 0.747 0.681 0.621 0.567 Period 5 0.519 0.476 0.437 0.402 Period 6 Period 7 0.942 0.888 0.837 0.790 0.746 0.705 0.630 0.564 0.507 0.933 0.871 0.813 0.760 0.711 0.665 0.583 0.513 0.452 Period 8 0.923 0.853 0.789 0.731 0.677 0.627 0.540 0.467 0.404 0.351 Period 9 0.914 0.837 0.766 0.703 0.645 0.592 0.500 0.424 0.361 0.308 Period 10 0.905 0.820 0.744 0.676 0.614 0.558 0.463 0.386 0.322 0.270 Period 11 0.896 0.804 0.722 0.650 0.585 0.527 0.429 Period 12 0.887 0.788 0.701 0.625 0.557 0.497 0.397 Period 13 0.879 0.773 0.681 0.601 0.530 0.469 0.368 Period 14 0.870 0.758 0.661 0.577 0.505 0.442 0.340 Period 15 0.861 0.743 0.642 0.555 0.481 0.417 0.315 Period 20 Period 25 Period 30 Period 40 0.820 0.780 0.742 0.673 0.554 0.456 0.377 0.312 0.215 0.149 0.104 0.073 0.051 0.037 0.026 0.610 0.478 0.375 0.295 0.233 0.146 0.092 0.059 0.038 0.024 0.016 0.010 0.552 0.412 0.308 0.231 0.174 0.099 0.057 0.033 0.020 0.012 0.007 0.004 0.672 0.453 0.307 0.208 0.142 0.097 0.046 0.022 0.011 0.005 0.003 0.001 0.001 Print 0.456 0.410 0.370 0.335 0.400 0.354 0.314 0.279 0.305 0.266 0.233 0.263 0.225 0.194 0.227 0.191 0.162 0.350 0.287 0.237 0.195 0.162 0.135 0.319 0.257 0.208 0.168 0.137 0.112 0.290 0.229 0.182 0.145 0.116 0.093 0.263 0.205 0.160 0.125 0.099 0.078 0.239 0.183 0.140 0.108 0.084 0.065 Done Future Value of Annuity of $1 3.374 3.440 Periods 1% 2% 3% 4% 5% 6% 8% 10% 12% Period 1 1.000 1.000 1.000 1.000 1.000 1.000 1,000 1,000 1.000 Period 2 2010 2020 2.030 2040 2.050 2.060 2.080 2.100 2.120 2.140 Period 3 3.030 3.060 3.091 3.122 3.153 3.184 3.246 3.310 4,060 4.122 4.184 4.246 4.310 4.375 4.506 4.641 4.779 5.416 5.526 5.637 5.867 6.975 7.336 8.536 8.394 8.923 9.487 10.089 10.730 9.897 10.637 11.436 12.300 13.233 Period 4 Period 5 5.101 5.204 5.309 6.105 6.353 7.716 8.115 6.152 6.308 6.468 6.633 6.802 7.214 7.434 7.662 7.898 8.142 8.286 8.583 8.892 9214 9.549 9.369 9.755 10.159 10.583 11.027 11.491 10.462 10.950 11.464 12.006 12.578 13.181 Period 6 Period 7 Period 8 Period 9 Period 10 Period 11 Period 12 Period 13 Period 14 Period 15 Period 20 Period 25 Period 30 Period 40 14% 1.000 16% 1.000 2.160 3.506 4.921 5.066 6.610 6.877 18% 1.000 2.180 3.572 5.215 7.154 20% 1.000 2.200 3.640 5.368 7.442 8.977 9.442 9.930 11.414 12.142 12.916 16.499 20.799 25.959 32.150 39.581 14.240 15.327 12.488 13.579 14.776 16.085 17.519 19.086 14.487 15.937 17.549 19.337 21.321 23.521 11.567 12.169 12.808 13.486 14.207 14.972 16.645 18.531 20.655 23.045 25.733 28.755 12.683 13.412 14,192 15.026 15.917 16.870 18.977 21.384 24.133 27.271 30.850 34.931 13.809 14.680 15.618 16.627 17.713 18.882 21 495 24.523 28.029 32.089 36.786 42219 48.497 14.947 15.974 17.086 18.292 19.599 21.015 24.215 27.975 32.393 37,581 16.097 17.293 18.599 20.024 21.579 23 276 27.152 31.772 37.280 43.842 22.019 24.297 26.870 29.778 33.066 36.786 45.762 57 275 72.052 91.025 115.380 146.628 186.688 28 243 32 030 36.459 41.646 47.727 54.865 73.106 98.347 133,334 181.871 249.214 342.603 471.981 34.785 40.568 47.575 56.085 66.439 79.058 113.283 164 494 241.333 356.787 530.312 790.948 1,181.882 48.886 60 402 75.401 95.026 120.800 154.762 259.057 442.593 767.091 1,342.025 2,360.757 4,163.213 7,343.858 59.196 72.035 43.672 50.818 51.660 60.965 Periods 1% Period 1 Period 2 Period 3 Period 4 Period 5 Period 6 Period 7 Period 8 Period 9. Period 10 Period 11 Period 12 Period 13 Period 14 Period 15 Period 20 Period 25 2% 3% 4% 1.010 1.020 1.030 1.040 1.020 1.040 1.061 1.082 1.030 1.061 1.093 1.125 1.041 1.082 1.051 Period 30 Period 40 1.126 1.170 1.104 1.159 1.217 1.062 1.126 1.194 1.265 1.072 1.149 1.230 1.316 1.083 1.172 1.267 1.369 1.094 1.195 1.305 1.423 1.105 1.219 1.344 1.480 1.116 1.243 1.127 1.138 1.149 1.161 1.384 1.539 1.710 1.898 2.332 1.268 1.426 1.601 1.796 2012 2.518 1.886 2.133 2.720 1.980 2.261 2.937 1.558 1.801 2.079 2.397 3.172 1.294 1.469 1.665 1.319 1.513 1.732 1.346 1.220 1.486 1.282 1.641 1,348 1.811 1.489 2.208 Future Value of $1 5% 1.050 1.060 6% 8% 10% 12% 1.080 1.100 1.120 1.103 1.124 1.166 1.210 1.254 1.158 1.191 1.260 1.331 1.360 1.464 1.469 1.611 1.216 1.262 1.276 1.338 1.806 2.191 2.094 2.427 1.340 1.419 1.587 1.772 1.974 2.195 2436 1.407 1.504 1.714 1.949 2.211 2.502 2.826 3.185 1.851 2.144 2.476 2.853 3.278 3.759 1.477 1.594 1.551 1.689 1.999 2.358 2.773 3.252 3.803 4.435 1.791 2.159 2.594 3.106 1.629 3.707 4.411 5.234 2.653 3.207 2.666 3.386 3.243 3.262 4.801 7.040 14% 16% 18% 1.140 1.160 1.180 1.300 1.405 1.482 1.561 1.643 1.346 1.392 1.574 1.689 1.811 1.939 1.762 1.925 2.100 2.288 4.322 5.743 20% 1.200 1.440 1.728 2.074 2.488 2.700 2.986 3.583 4.300 5.160 6.192 38.338 4.661 6.727 4.292 6.848 10.835 9.646 13.743 19.461 27.393 17.000 26.462 40.874 62.669 95.396 10.063 17 449 29.960 50.950 85.850 143.371 237.376 10 286 21.725 45.259 93.051 188.884 378.721 750 378 1,469.772 6.176 7.430 2.853 3.479 4.226 5.117 3.138 3.896 4.818 3.452 4.363 5.492 5.936 7.288 8.916 6.886 8.599 10.699 3.797 4.887 6.261 7.988 10.147 12.839 4.177 5.474 7.138 9.266 11.974 15.407 1. Compute the payback period, the ARR, and the NPV of these two plans. What are the strengths and weaknesses of these capital budgeting models? 2. Which expansion plan should Mugs choose? Why? 3. Estimate Plan A's IRR. How does the IRR compare with the company's required rate of return?
Expert Answer:

Related Book For 

Financial and Managerial Accounting
ISBN: 978-0132497978
3rd Edition
Authors: Horngren, Harrison, Oliver
Posted Date:
Students also viewed these accounting questions
-
Discuss the implications of the following statement: It is interesting to note that poultry is Indias most efficient converter of low fibre food stuff (which is unfit for human consumption) into...
-
a chain of sandwich shops. The company is considering two possible expansion plans. Plan A would open eight smaller shops at a cost of $ 8,440,000. Expected annual net cash inflows are $ 1,600,000...
-
The following data represent the muzzle velocity (in feet per second) of rounds red from a 155-mm gun. For each round, two measurements of the velocity were recorded using two different measuring...
-
Modern vacuum pumps permit the pressures down to p = 4.10-15 atm to be reached at room temperatures. Assuming that the gas exhausted is nitrogen, find the number of its molecules per 1 cm 3 and the...
-
Firm K, a non-corporate taxpayer, has owned investment land with a $600,000 basis for four years. Two unrelated parties want to acquire the land from K. Party A has offered $770,000 cash, and Party B...
-
It looks to me that you have devoted everything to this company and they have treated you badly. Is that right?
-
As part of the budgeting process, Northview Corporations CFO is developing the overhead budget for next year for its Evans Division. The division estimates that it will manufacture 150,000 units...
-
Alice wants to buy apples, beets, and carrots. An apple, a beet, and a carrot cost 16 dollars, two apples and three beets cost 23 dollars, and one apple, two beets, and three carrots cost 35 dollars....
-
Draw a truth table for the circuit in Figure P2.40 and explain what it does. FIGURE P2.30 A B P R C
-
Evaluate the investment portfolio risk, if it consists from 3 securities. Weight of is 0,3, Weight of is 0,25, Weight of is 0,45. Covariation matrix is: 0,5 0,25 0,1 0,25 0,6 0,3 0,1 0,3 0,8
-
Tendai is a welder who started his own business making security gates, fences and other related steel product . Unit of capital employed Unit of Capital employed Output quantity (Q) 10 340 560 800 1...
-
Stock AAA pays semiannual dividends. The stock has just paid a dividend, thus the next dividend is expected to be paid in exactly 6 months and each subsequent dividend is expected to be paid 6 months...
-
Explain what do you understand by data normalization? Explain various forms used in data normalization. What is a primary key and a foreign key?
-
Many species in the genus Bacillus (e.g. B. cereus) have a high TDT and TDP, but they are not classified as thermophiles. Please explain.
-
Conclude whether or not Kotter believes that all individuals who are resistant to change can gradually be "won over" in cases of significant change based on this week's video, John Kotter -...
-
Solve the system equations (using matrices) 2x1 - x2 +3x3 + 4x4 = 9 %3D x1 + 0x2 - 2x3 +7x4 11 3x1 3x2 + x3 +5x4 = 8 %3D 2x1 + x2 + 4x3 +4x4 10 %3D
-
Suppose that you are part of a virtual team and must persuade other team members on an important matter (such as switching suppliers or altering the project deadline). Assuming that you cannot visit...
-
You have just begun your summer internship at Omni Instruments. The company supplies sterilized surgical instruments for physicians. To expand sales, Omni is considering paying a commission to its...
-
The comparative financial statements of Perfection Cosmetic Supply for 2012, 2011, and 2010 include the data that follow: Requirements 1. Compute these ratios for 2012 and 2011: a. Acid-test ratio b....
-
Return to the Yummy, Inc., data in Short Exercise 13-3. Assume instead that the December 15, 2012 stock dividend was 45%. Requirements 1. Journalize the stock dividend. 2. How many shares of common...
-
Discuss the main differences between the traditional and the modern finance paradigm in understanding the behavior of individual investors.
-
Discuss the disposition effect and the proposed explanations for this effect.
-
Define and describe the process of worrying within the finance domain.

Study smarter with the SolutionInn App