

Question: multicolumn2 c Regression Statistics Multiple R 0.6261 R Square 0.392 Adjusted R Square 0.1893 Standard Error 20.39 Observations 5 ANOVA df SS MS F Significance
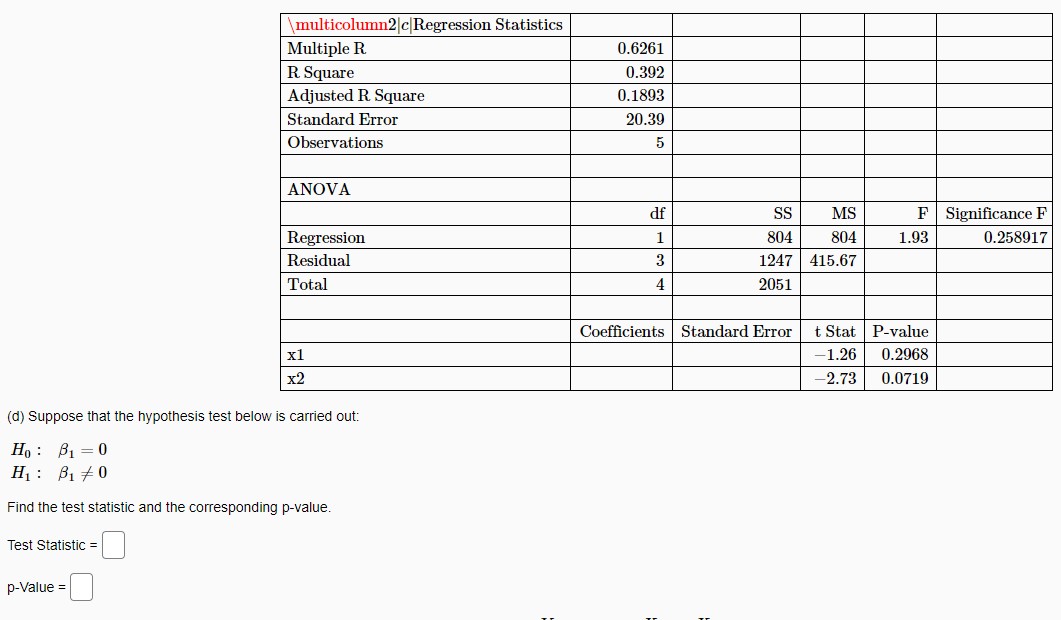
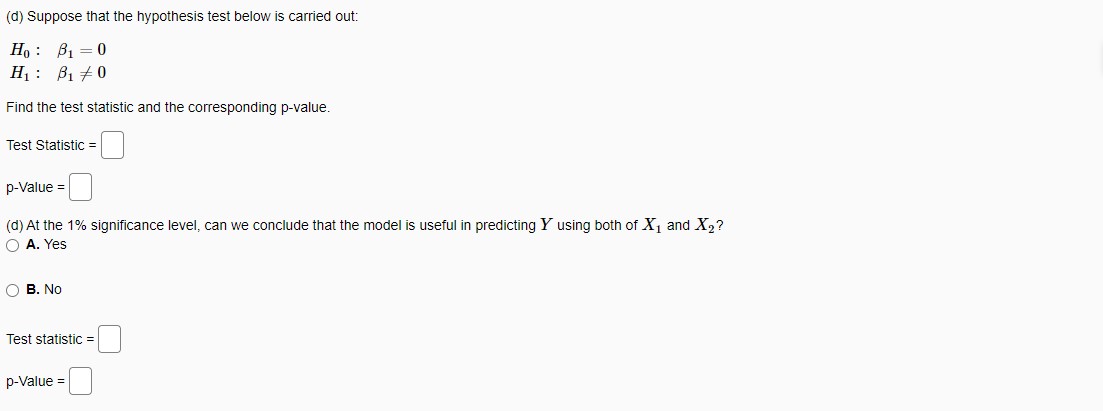
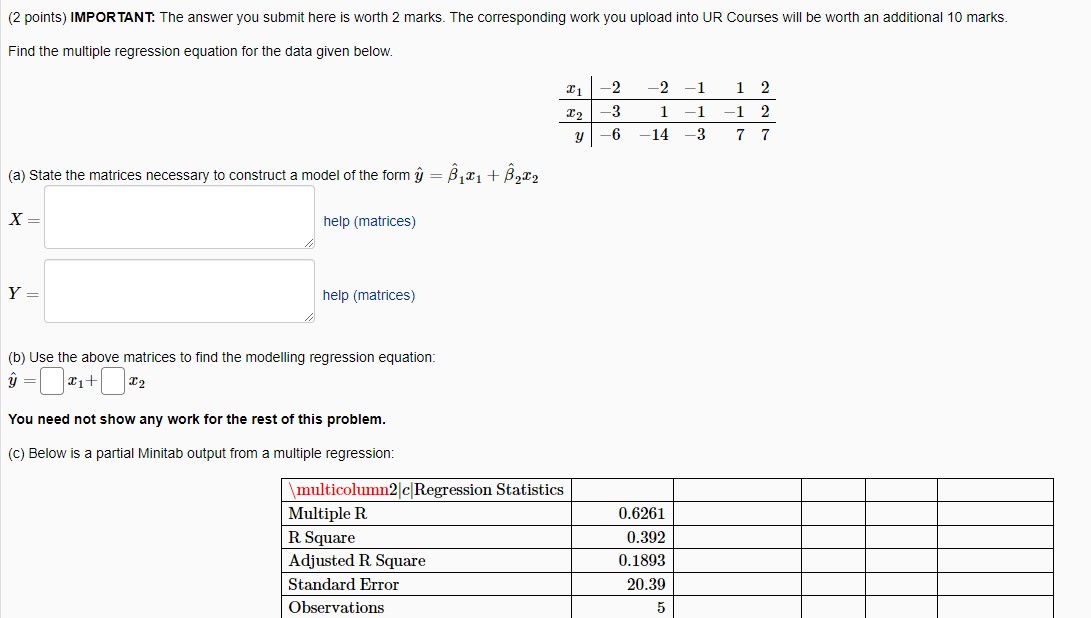
multicolumn2 c Regression Statistics Multiple R 0.6261 R Square 0.392 Adjusted R Square 0.1893 Standard Error 20.39 Observations 5 ANOVA df SS MS F Significance F Regression 1 804 804 1.93 0.258917 Residual 3 1247 415.67 Total 4 2051 Coefficients | Standard Error t Stat P-value x1 1.26 0.2968 x2 -2.73 0.0719 (d) Suppose that the hypothesis test below is carried out: Ho : B1 = 0 H1 : B140 Find the test statistic and the corresponding p-value. Test Statistic = p-Value =(d) Suppose that the hypothesis test below is carried out: Ho : B1 = 0 H1: B140 Find the test statistic and the corresponding p-value. Test Statistic = p-Value = (d) At the 1% significance level, can we conclude that the model is useful in predicting Y using both of X, and X2? O A. Yes O B. No Test statistic = p-Value =(2 points) IMPORTANT. The answer you submit here is worth 2 marks. The corresponding work you upload into UR Courses will be worth an additional 10 marks. Find the multiple regression equation for the data given below. -2 -2 -1 1 2 -3 1 -1 -1 2 y -6 -14 -3 7 7 (a) State the matrices necessary to construct a model of the form y = B,$1 + B2x2 X = help (matrices) Y = help (matrices) (b) Use the above matrices to find the modelling regression equation: y = You need not show any work for the rest of this problem. (c) Below is a partial Minitab output from a multiple regression: multicolumn2|c Regression Statistics Multiple R 0.6261 R Square 0.392 Adjusted R Square 0.1893 Standard Error 20.39 Observations 5
Step by Step Solution
There are 3 Steps involved in it

Get step-by-step solutions from verified subject matter experts