

Question: MULTIPLE CHOICE. Choose the one alternative that best completes the statement or answers the question. 1) In the graph below, the area between the lines
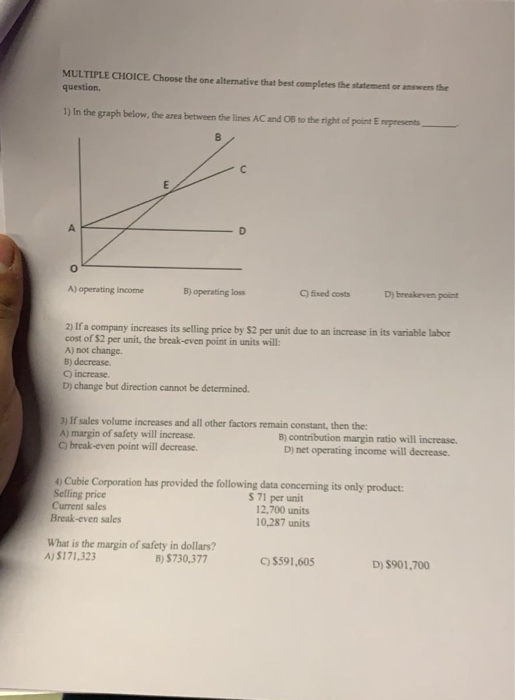
MULTIPLE CHOICE. Choose the one alternative that best completes the statement or answers the question. 1) In the graph below, the area between the lines AC and O8 to the right of point E represents A) operating income B) operating loss C) fixed costs D) breakeven point 2) If a company increases its selling price by S2 per unit due to an increase in its variable labor cost of $2 per unit, the break-even point in units will: A) not change. B) decrease. O) increase. D) change but direction cannot be determined. 3) If sales volume increases and all other factors remain constant, then the: A) margin of safety will increase C) break-even point will decrease. B) contribution margin ratio will increase D) net operating income will decrease. o Cubie Corporation has provided the following data concerning its only product Selling price Current sales Break-even sales S 71 per unit 12,700 units 10,287 units What is the margin of safety in dollars? A) $171,323 C) $591,605 B) $730,377 D) $901,700
Step by Step Solution
There are 3 Steps involved in it

Get step-by-step solutions from verified subject matter experts