

Question: Multiple choice for step 2.2 and 2.3. Based on graph select correct statement from plot. Need asap, for thumbs up Step 2.2 Plot the following
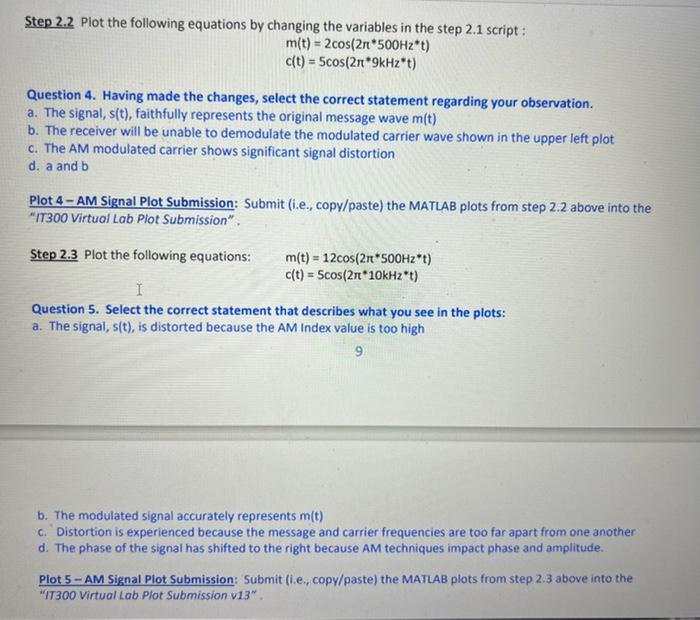
Step 2.2 Plot the following equations by changing the variables in the step 2.1 script : m(t)=2cos(2500Hzt)c(t)=5cos(29kHzt) Question 4. Having made the changes, select the correct statement regarding your observation. a. The signal, s(t), faithfully represents the original message wave m(t) b. The receiver will be unable to demodulate the modulated carrier wave shown in the upper left plot c. The AM modulated carrier shows significant signal distortion d. a and b Plot 4 - AM Signal Plot Submission: Submit (i.e., copy/paste) the MATLAB plots from step 2.2 above into the "IT300 Virtual Lab Plot Submission". Step 2.3 Plot the following equations: m(t)=12cos(2500Hzt)c(t)=5cos(210kH2t) Question 5. Select the correct statement that describes what you see in the plots: a. The signal, s(t), is distorted because the AM Index value is too high 9 b. The modulated signal accurately represents m(t) c. Distortion is experienced because the message and carrier frequencies are too far apart from one another d. The phase of the signal has shifted to the right because AM techniques impact phase and amplitude. Plot 5 - AM Signal Plot Submission: Submit (i.e., copy/paste) the MATLAB plots from step 2.3 above into the "IT300 Virtual Lab Plot Submission v13
Step by Step Solution
There are 3 Steps involved in it

Get step-by-step solutions from verified subject matter experts