

Question: Multiple choice given is A. 0.989, B. -0.647, C. 0.558 and D. 0.995. The data referred to in this question were collected from several sales
Multiple choice given is A. 0.989, B. -0.647, C. 0.558 and D. 0.995.
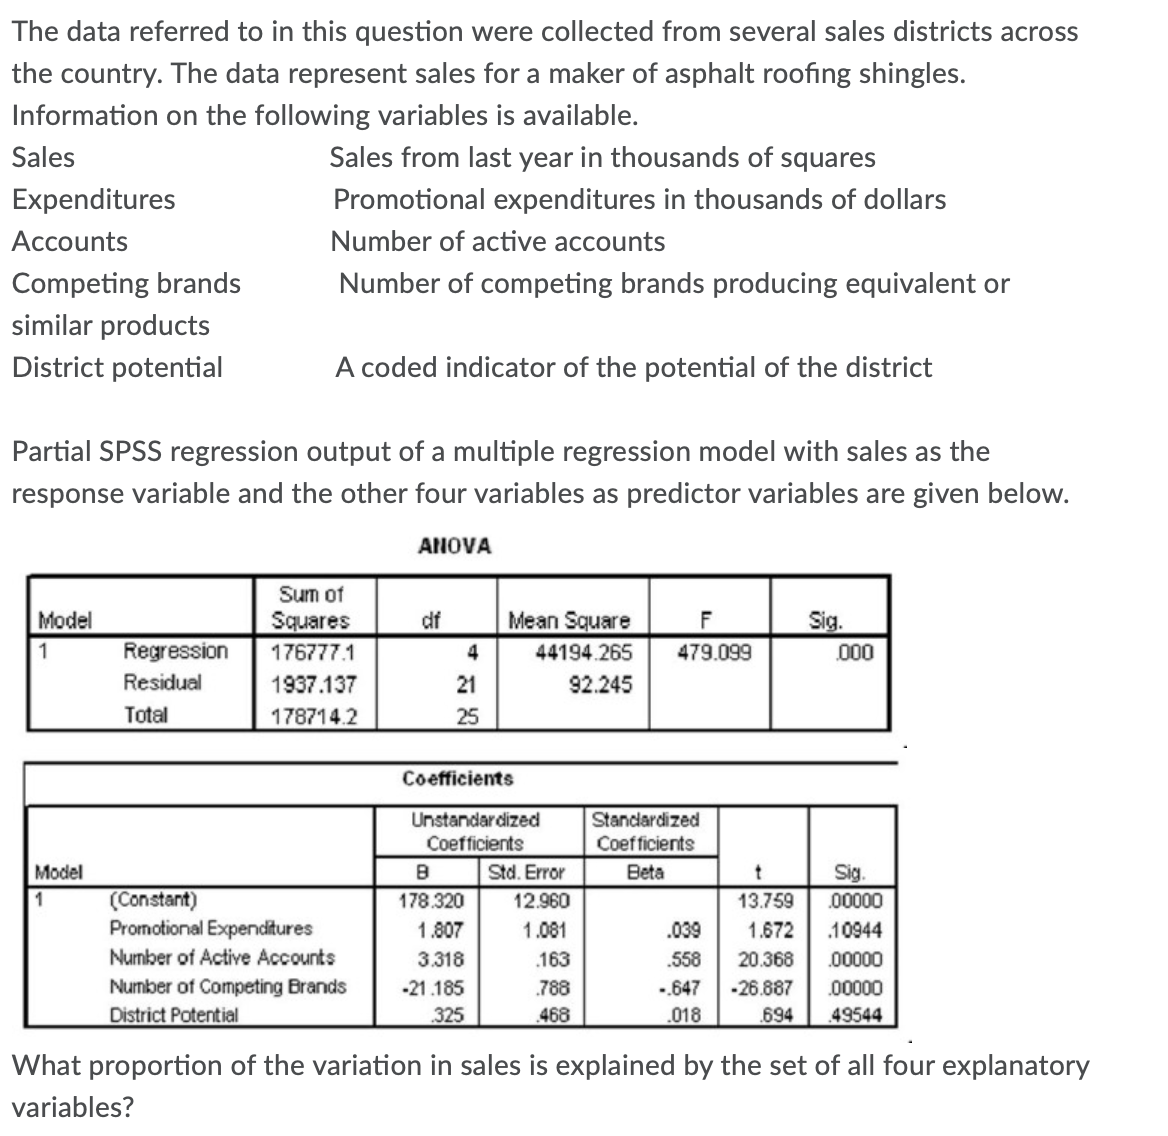
The data referred to in this question were collected from several sales districts across the country. The data represent sales for a maker of asphalt roong shingles. Information on the following variables is available. Sales Sales from last year in thousands of squares Expenditures Promotional expenditures in thousands of dollars Accounts Number of active accounts Competing brands Number of competing brands producing equivalent or similar products District potential A coded indicator of the potential of the district Partial SPSS regression output of a multiple regression model with sales as the response variable and the other four variables as predictor variables are given below. _nn ' I! Royassinn 17'6??i'.1 \"194.265 479.0% 1 937.1 37 92.245 17871 '2 What proportion of the variation in sales is explained by the set of all four explanatory variables
Step by Step Solution
There are 3 Steps involved in it

Get step-by-step solutions from verified subject matter experts