

Question: Multiple choice questions below Draw a curve that shows the effect of a virus that destroys potato crops and decreases the quantity of potato chips
Multiple choice questions below
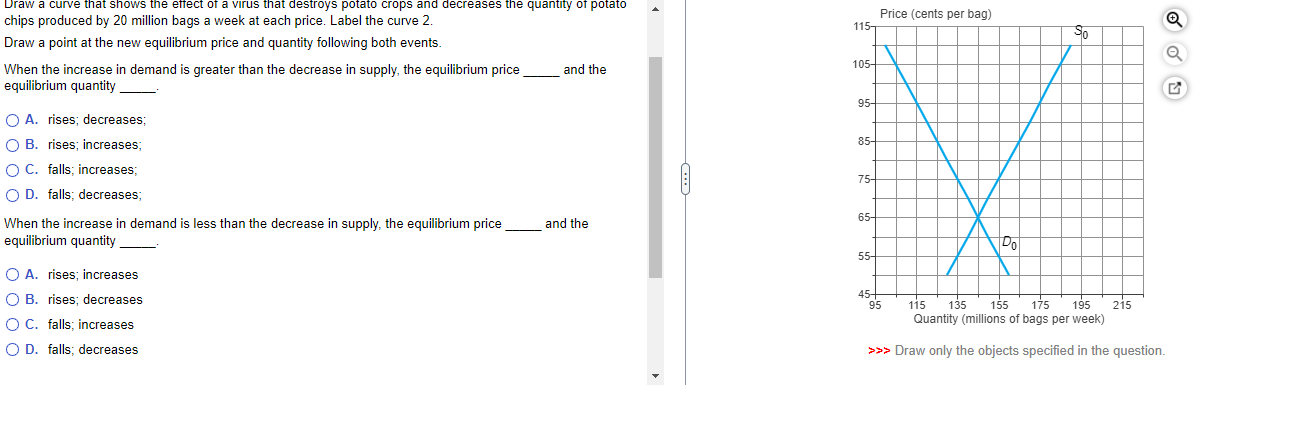
Draw a curve that shows the effect of a virus that destroys potato crops and decreases the quantity of potato chips produced by 20 million bags a week at each price. Label the curve 2. Price (cents per bag) 115T So Draw a point at the new equilibrium price and quantity following both events. When the increase in demand is greater than the decrease in supply, the equilibrium price and the 105- equilibrium quantity 95- O A. rises; decreases; O B. rises; increases; 85- O C. falls; increases; 75 O D. falls; decreases; When the increase in demand is less than the decrease in supply, the equilibrium price 65 and the equilibrium quantity Do 55- O A. rises; increases O B. rises; decreases 45- 95 115 135 155 175 195 215 O C. falls; increases Quantity (millions of bags per week) O D. falls; decreases > >> Draw only the objects specified in the
Step by Step Solution
There are 3 Steps involved in it

Get step-by-step solutions from verified subject matter experts