

Question: ** MULTIPLE PART QUESTION** (60 points) Financial Forecasting Sue Wilson, the new financial manager of New World Chemicals (NWC), a California producer of specialized chemicals
** MULTIPLE PART QUESTION**
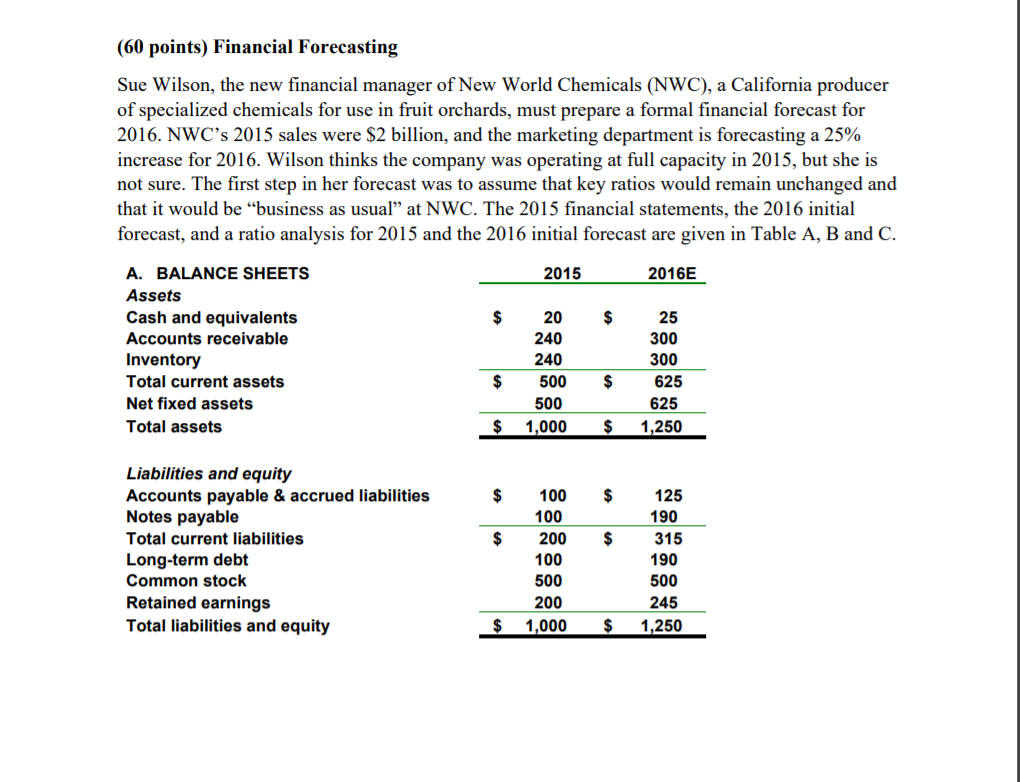
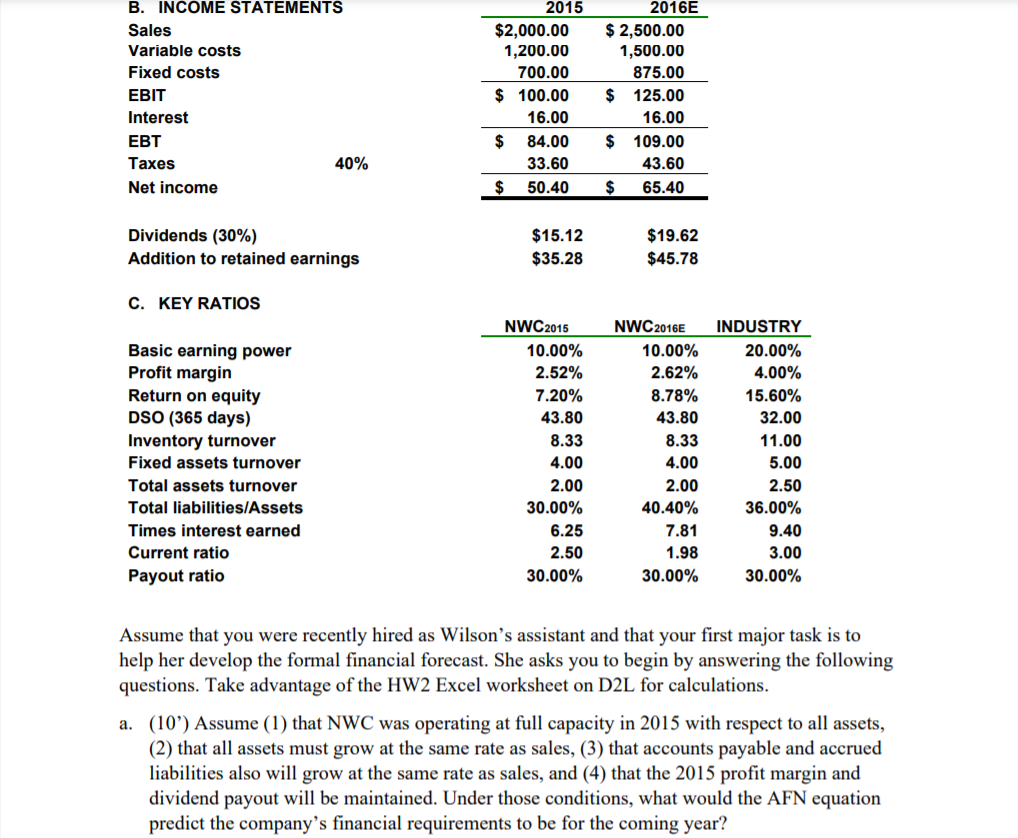
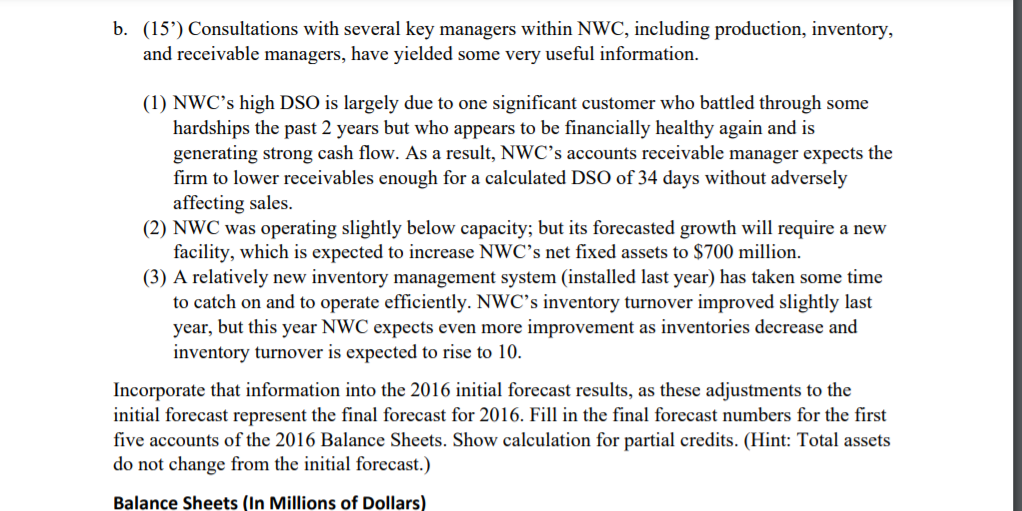
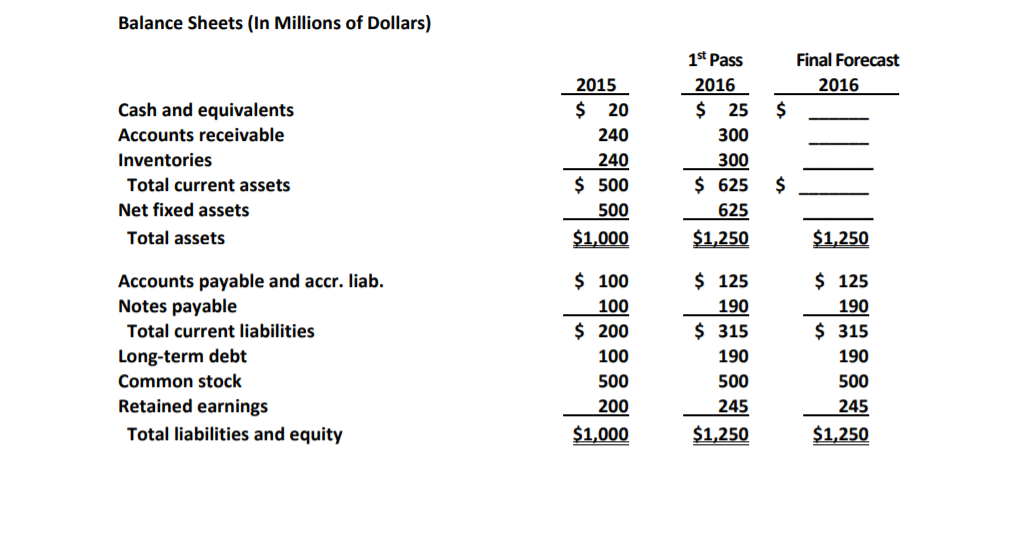
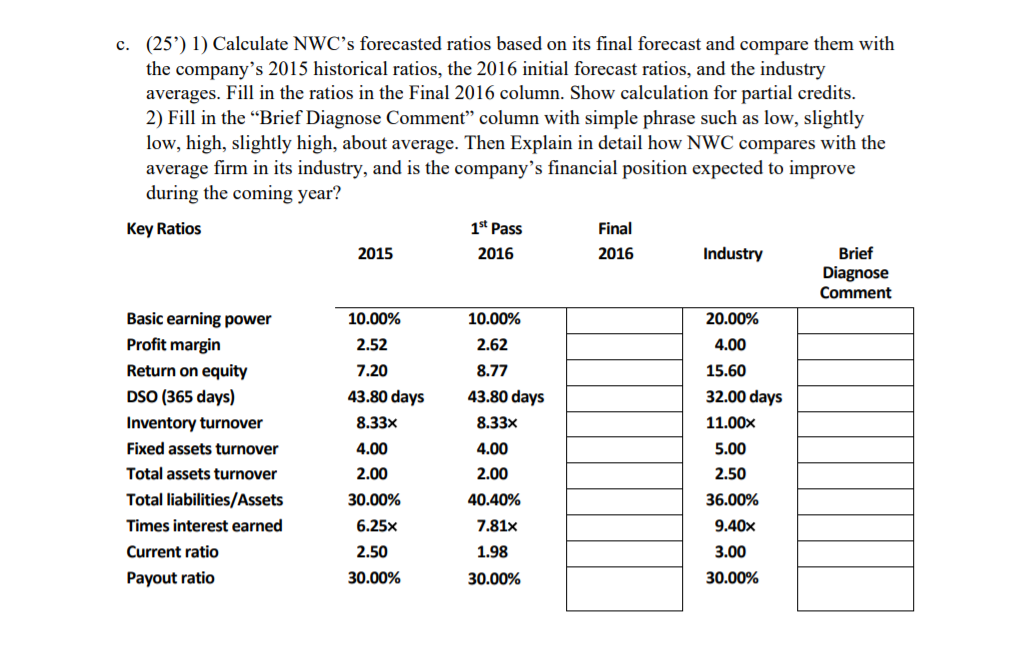
(60 points) Financial Forecasting Sue Wilson, the new financial manager of New World Chemicals (NWC), a California producer of specialized chemicals for use in fruit orchards, must prepare a formal financial forecast for 2016. NWC's 2015 sales were $2 billion, and the marketing department is forecasting a 25% increase for 2016. Wilson thinks the company was operating at full capacity in 2015, but she is not sure. The first step in her forecast was to assume that key ratios would remain unchanged and that it would be "business as usual at NWC. The 2015 financial statements, the 2016 initial forecast, and a ratio analysis for 2015 and the 2016 initial forecast are given in Table A, B and C. 2015 2016E $ $ A. BALANCE SHEETS Assets Cash and equivalents Accounts receivable Inventory Total current assets Net fixed assets Total assets 20 240 240 500 500 1,000 25 300 300 625 625 1,250 $ $ $ $ $ $ $ $ Liabilities and equity Accounts payable & accrued liabilities Notes payable Total current liabilities Long-term debt Common stock Retained earnings Total liabilities and equity 100 100 200 100 500 200 1,000 125 190 315 190 500 245 1,250 $ $ B. INCOME STATEMENTS Sales Variable costs Fixed costs EBIT Interest EBT Taxes 40% Net income 2015 $2,000.00 1,200.00 700.00 $ 100.00 16.00 $ 84.00 33.60 $ 50.40 2016E $ 2,500.00 1,500.00 875.00 $ 125.00 16.00 $ 109.00 43.60 $ 65.40 $19.62 Dividends (30%) Addition to retained earnings $15.12 $35.28 $45.78 C. KEY RATIOS Basic earning power Profit margin Return on equity DSO (365 days) Inventory turnover Fixed assets turnover Total assets turnover Total liabilities/Assets Times interest earned Current ratio Payout ratio NWC2015 10.00% 2.52% 7.20% 43.80 8.33 4.00 2.00 30.00% 6.25 2.50 30.00% NWC 2016 10.00% 2.62% 8.78% 43.80 8.33 4.00 2.00 40.40% 7.81 1.98 30.00% INDUSTRY 20.00% 4.00% 15.60% 32.00 11.00 5.00 2.50 36.00% 9.40 3.00 30.00% Assume that you were recently hired as Wilson's assistant and that your first major task is to help her develop the formal financial forecast. She asks you to begin by answering the following questions. Take advantage of the HW2 Excel worksheet on D2L for calculations. a. (10') Assume (1) that NWC was operating at full capacity in 2015 with respect to all assets, (2) that all assets must grow at the same rate as sales, (3) that accounts payable and accrued liabilities also will grow at the same rate as sales, and (4) that the 2015 profit margin and dividend payout will be maintained. Under those conditions, what would the AFN equation predict the company's financial requirements to be for the coming year? b. (15') Consultations with several key managers within NWC, including production, inventory, and receivable managers, have yielded some very useful information. (1) NWC's high DSO is largely due to one significant customer who battled through some hardships the past 2 years but who appears to be financially healthy again and is generating strong cash flow. As a result, NWC's accounts receivable manager expects the firm to lower receivables enough for a calculated DSO of 34 days without adversely affecting sales. (2) NWC was operating slightly below capacity; but its forecasted growth will require a new facility, which is expected to increase NWC's net fixed assets to $700 million. (3) A relatively new inventory management system (installed last year) has taken some time to catch on and to operate efficiently. NWC's inventory turnover improved slightly last year, but this year NWC expects even more improvement as inventories decrease and inventory turnover is expected to rise to 10. Incorporate that information into the 2016 initial forecast results, as these adjustments to the initial forecast represent the final forecast for 2016. Fill in the final forecast numbers for the first five accounts of the 2016 Balance Sheets. Show calculation for partial credits. (Hint: Total assets do not change from the initial forecast.) Balance Sheets (in Millions of Dollars) Balance Sheets (in Millions of Dollars) Final Forecast 2016 $ Cash and equivalents Accounts receivable Inventories Total current assets Net fixed assets Total assets 2015 $ 20 240 240 $ 500 500 $1,000 1st Pass 2016 $ 25 300 300 $ 625 625 $1,250 $ $1,250 Accounts payable and accr. liab. Notes payable Total current liabilities Long-term debt Common stock Retained earnings Total liabilities and equity $ 100 100 $ 200 100 500 200 $1,000 $ 125 190 $ 315 190 500 245 $1,250 $ 125 190 $ 315 190 500 245 $1,250 c. (25') 1) Calculate NWC's forecasted ratios based on its final forecast and compare them with the company's 2015 historical ratios, the 2016 initial forecast ratios, and the industry averages. Fill in the ratios in the Final 2016 column. Show calculation for partial credits. 2) Fill in the Brief Diagnose Comment column with simple phrase such as low, slightly low, high, slightly high, about average. Then Explain in detail how NWC compares with the average firm in its industry, and is the company's financial position expected to improve during the coming year? Key Ratios 1st Pass 2016 Final 2016 2015 Industry Brief Diagnose Comment Basic earning power Profit margin Return on equity DSO (365 days) Inventory turnover Fixed assets turnover Total assets turnover Total liabilities/Assets Times interest earned Current ratio Payout ratio 10.00% 2.52 7.20 43.80 days 8.33x 4.00 2.00 30.00% 6.25x 10.00% 2.62 8.77 43.80 days 8.33x 4.00 2.00 40.40% 7.81x 20.00% 4.00 15.60 32.00 days 11.00 5.00 2.50 36.00% 9.40x 3.00 2.50 1.98 30.00% 30.00% 30.00% d. (10') Initially, some NWC managers questioned whether the new facility expansion was necessary, especially as it results in increasing net fixed assets from $500 million to $700 million (a 40% increase). However, after extensive discussions about NWC needing to position itself for future growth and being flexible and competitive in today's marketplace, NWC's top managers agreed that the expansion was necessary. Among the issues raised by opponents was that NWC's fixed assets were being operated at only 85% of capacity. Assuming that its fixed assets were operating at only 85% of capacity, by how much could sales have increased, both in dollar terms and in percentage terms, before NWC reached full capacity? (60 points) Financial Forecasting Sue Wilson, the new financial manager of New World Chemicals (NWC), a California producer of specialized chemicals for use in fruit orchards, must prepare a formal financial forecast for 2016. NWC's 2015 sales were $2 billion, and the marketing department is forecasting a 25% increase for 2016. Wilson thinks the company was operating at full capacity in 2015, but she is not sure. The first step in her forecast was to assume that key ratios would remain unchanged and that it would be "business as usual at NWC. The 2015 financial statements, the 2016 initial forecast, and a ratio analysis for 2015 and the 2016 initial forecast are given in Table A, B and C. 2015 2016E $ $ A. BALANCE SHEETS Assets Cash and equivalents Accounts receivable Inventory Total current assets Net fixed assets Total assets 20 240 240 500 500 1,000 25 300 300 625 625 1,250 $ $ $ $ $ $ $ $ Liabilities and equity Accounts payable & accrued liabilities Notes payable Total current liabilities Long-term debt Common stock Retained earnings Total liabilities and equity 100 100 200 100 500 200 1,000 125 190 315 190 500 245 1,250 $ $ B. INCOME STATEMENTS Sales Variable costs Fixed costs EBIT Interest EBT Taxes 40% Net income 2015 $2,000.00 1,200.00 700.00 $ 100.00 16.00 $ 84.00 33.60 $ 50.40 2016E $ 2,500.00 1,500.00 875.00 $ 125.00 16.00 $ 109.00 43.60 $ 65.40 $19.62 Dividends (30%) Addition to retained earnings $15.12 $35.28 $45.78 C. KEY RATIOS Basic earning power Profit margin Return on equity DSO (365 days) Inventory turnover Fixed assets turnover Total assets turnover Total liabilities/Assets Times interest earned Current ratio Payout ratio NWC2015 10.00% 2.52% 7.20% 43.80 8.33 4.00 2.00 30.00% 6.25 2.50 30.00% NWC 2016 10.00% 2.62% 8.78% 43.80 8.33 4.00 2.00 40.40% 7.81 1.98 30.00% INDUSTRY 20.00% 4.00% 15.60% 32.00 11.00 5.00 2.50 36.00% 9.40 3.00 30.00% Assume that you were recently hired as Wilson's assistant and that your first major task is to help her develop the formal financial forecast. She asks you to begin by answering the following questions. Take advantage of the HW2 Excel worksheet on D2L for calculations. a. (10') Assume (1) that NWC was operating at full capacity in 2015 with respect to all assets, (2) that all assets must grow at the same rate as sales, (3) that accounts payable and accrued liabilities also will grow at the same rate as sales, and (4) that the 2015 profit margin and dividend payout will be maintained. Under those conditions, what would the AFN equation predict the company's financial requirements to be for the coming year? b. (15') Consultations with several key managers within NWC, including production, inventory, and receivable managers, have yielded some very useful information. (1) NWC's high DSO is largely due to one significant customer who battled through some hardships the past 2 years but who appears to be financially healthy again and is generating strong cash flow. As a result, NWC's accounts receivable manager expects the firm to lower receivables enough for a calculated DSO of 34 days without adversely affecting sales. (2) NWC was operating slightly below capacity; but its forecasted growth will require a new facility, which is expected to increase NWC's net fixed assets to $700 million. (3) A relatively new inventory management system (installed last year) has taken some time to catch on and to operate efficiently. NWC's inventory turnover improved slightly last year, but this year NWC expects even more improvement as inventories decrease and inventory turnover is expected to rise to 10. Incorporate that information into the 2016 initial forecast results, as these adjustments to the initial forecast represent the final forecast for 2016. Fill in the final forecast numbers for the first five accounts of the 2016 Balance Sheets. Show calculation for partial credits. (Hint: Total assets do not change from the initial forecast.) Balance Sheets (in Millions of Dollars) Balance Sheets (in Millions of Dollars) Final Forecast 2016 $ Cash and equivalents Accounts receivable Inventories Total current assets Net fixed assets Total assets 2015 $ 20 240 240 $ 500 500 $1,000 1st Pass 2016 $ 25 300 300 $ 625 625 $1,250 $ $1,250 Accounts payable and accr. liab. Notes payable Total current liabilities Long-term debt Common stock Retained earnings Total liabilities and equity $ 100 100 $ 200 100 500 200 $1,000 $ 125 190 $ 315 190 500 245 $1,250 $ 125 190 $ 315 190 500 245 $1,250 c. (25') 1) Calculate NWC's forecasted ratios based on its final forecast and compare them with the company's 2015 historical ratios, the 2016 initial forecast ratios, and the industry averages. Fill in the ratios in the Final 2016 column. Show calculation for partial credits. 2) Fill in the Brief Diagnose Comment column with simple phrase such as low, slightly low, high, slightly high, about average. Then Explain in detail how NWC compares with the average firm in its industry, and is the company's financial position expected to improve during the coming year? Key Ratios 1st Pass 2016 Final 2016 2015 Industry Brief Diagnose Comment Basic earning power Profit margin Return on equity DSO (365 days) Inventory turnover Fixed assets turnover Total assets turnover Total liabilities/Assets Times interest earned Current ratio Payout ratio 10.00% 2.52 7.20 43.80 days 8.33x 4.00 2.00 30.00% 6.25x 10.00% 2.62 8.77 43.80 days 8.33x 4.00 2.00 40.40% 7.81x 20.00% 4.00 15.60 32.00 days 11.00 5.00 2.50 36.00% 9.40x 3.00 2.50 1.98 30.00% 30.00% 30.00% d. (10') Initially, some NWC managers questioned whether the new facility expansion was necessary, especially as it results in increasing net fixed assets from $500 million to $700 million (a 40% increase). However, after extensive discussions about NWC needing to position itself for future growth and being flexible and competitive in today's marketplace, NWC's top managers agreed that the expansion was necessary. Among the issues raised by opponents was that NWC's fixed assets were being operated at only 85% of capacity. Assuming that its fixed assets were operating at only 85% of capacity, by how much could sales have increased, both in dollar terms and in percentage terms, before NWC reached full capacity
Step by Step Solution
There are 3 Steps involved in it

Get step-by-step solutions from verified subject matter experts