

Question: Multiple regression analysis in Excel produced the following tables: Multiple regression analysis in Excel produced the following tables: Coefficients Standard Error Intercept 789.8828 126.1765 -1.0349
Multiple regression analysis in Excel produced the following tables:
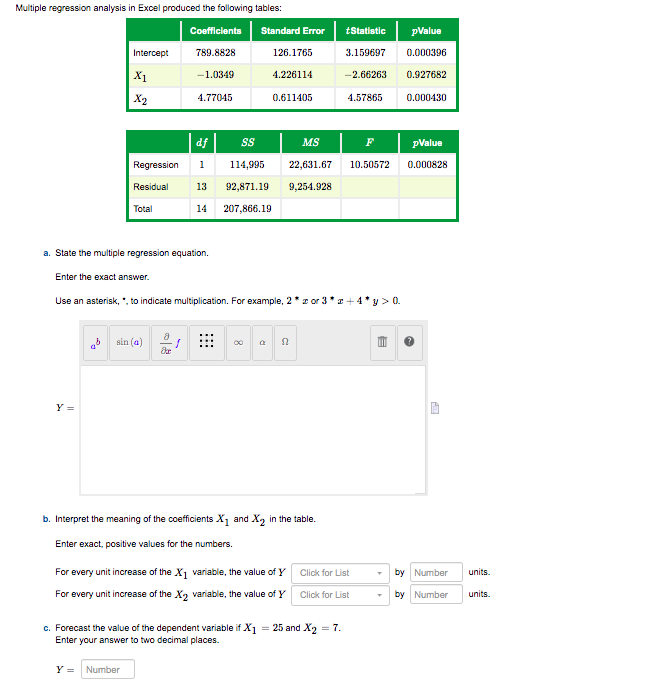
Multiple regression analysis in Excel produced the following tables: Coefficients Standard Error Intercept 789.8828 126.1765 -1.0349 4.226114 X2 4.77045 0.611405 Statistic 3.159697 -2.66263 4.57865 pValue 0.000396 0.927682 0.000430 pValue 0.000828 Regression Residual Total of SSMS F 1 114,995 22,631.67 10.50572 1392,871.199.254.928 14 207,866.19 a. State the multiple regression equation. Enter the exact answer. Use an asterisk, .. to indicate multiplication. For example, 2 zor 3 2 +4*y> 0. b. Interpret the meaning of the coefficients X1 and X2 in the table. Enter exact, positive values for the numbers. units. For every unit increase of the X1 variable, the value of Y For every unit increase of the X2 variable, the value of Y Click for List Click for List - by Number - by Number units. c. Forecast the value of the dependent variable if X1 = 25 and X2 = 7. Enter your answer to two decimal places. Y = Number Multiple regression analysis in Excel produced the following tables: Coefficients Standard Error Intercept 789.8828 126.1765 -1.0349 4.226114 X2 4.77045 0.611405 Statistic 3.159697 -2.66263 4.57865 pValue 0.000396 0.927682 0.000430 pValue 0.000828 Regression Residual Total of SSMS F 1 114,995 22,631.67 10.50572 1392,871.199.254.928 14 207,866.19 a. State the multiple regression equation. Enter the exact answer. Use an asterisk, .. to indicate multiplication. For example, 2 zor 3 2 +4*y> 0. b. Interpret the meaning of the coefficients X1 and X2 in the table. Enter exact, positive values for the numbers. units. For every unit increase of the X1 variable, the value of Y For every unit increase of the X2 variable, the value of Y Click for List Click for List - by Number - by Number units. c. Forecast the value of the dependent variable if X1 = 25 and X2 = 7. Enter your answer to two decimal places. Y = Number
Step by Step Solution
There are 3 Steps involved in it

Get step-by-step solutions from verified subject matter experts