

Question: Multiple Regression Report This assignment will help you understand proper reporting and interpretation of multiple regression. You will use the IBM SPSS Linear Regression procedure

Multiple Regression Report
This assignment will help you understand proper reporting and interpretation of multiple regression. You will use the IBM SPSS Linear Regression procedure to accurately compute a multiple regression with the Regression Data file given in the resources. Use the DAA Template given in the resources to write up your assignment. The deadline for submitting your work is 11:59 p.m. Central time on Sunday of this unit.
Step 1
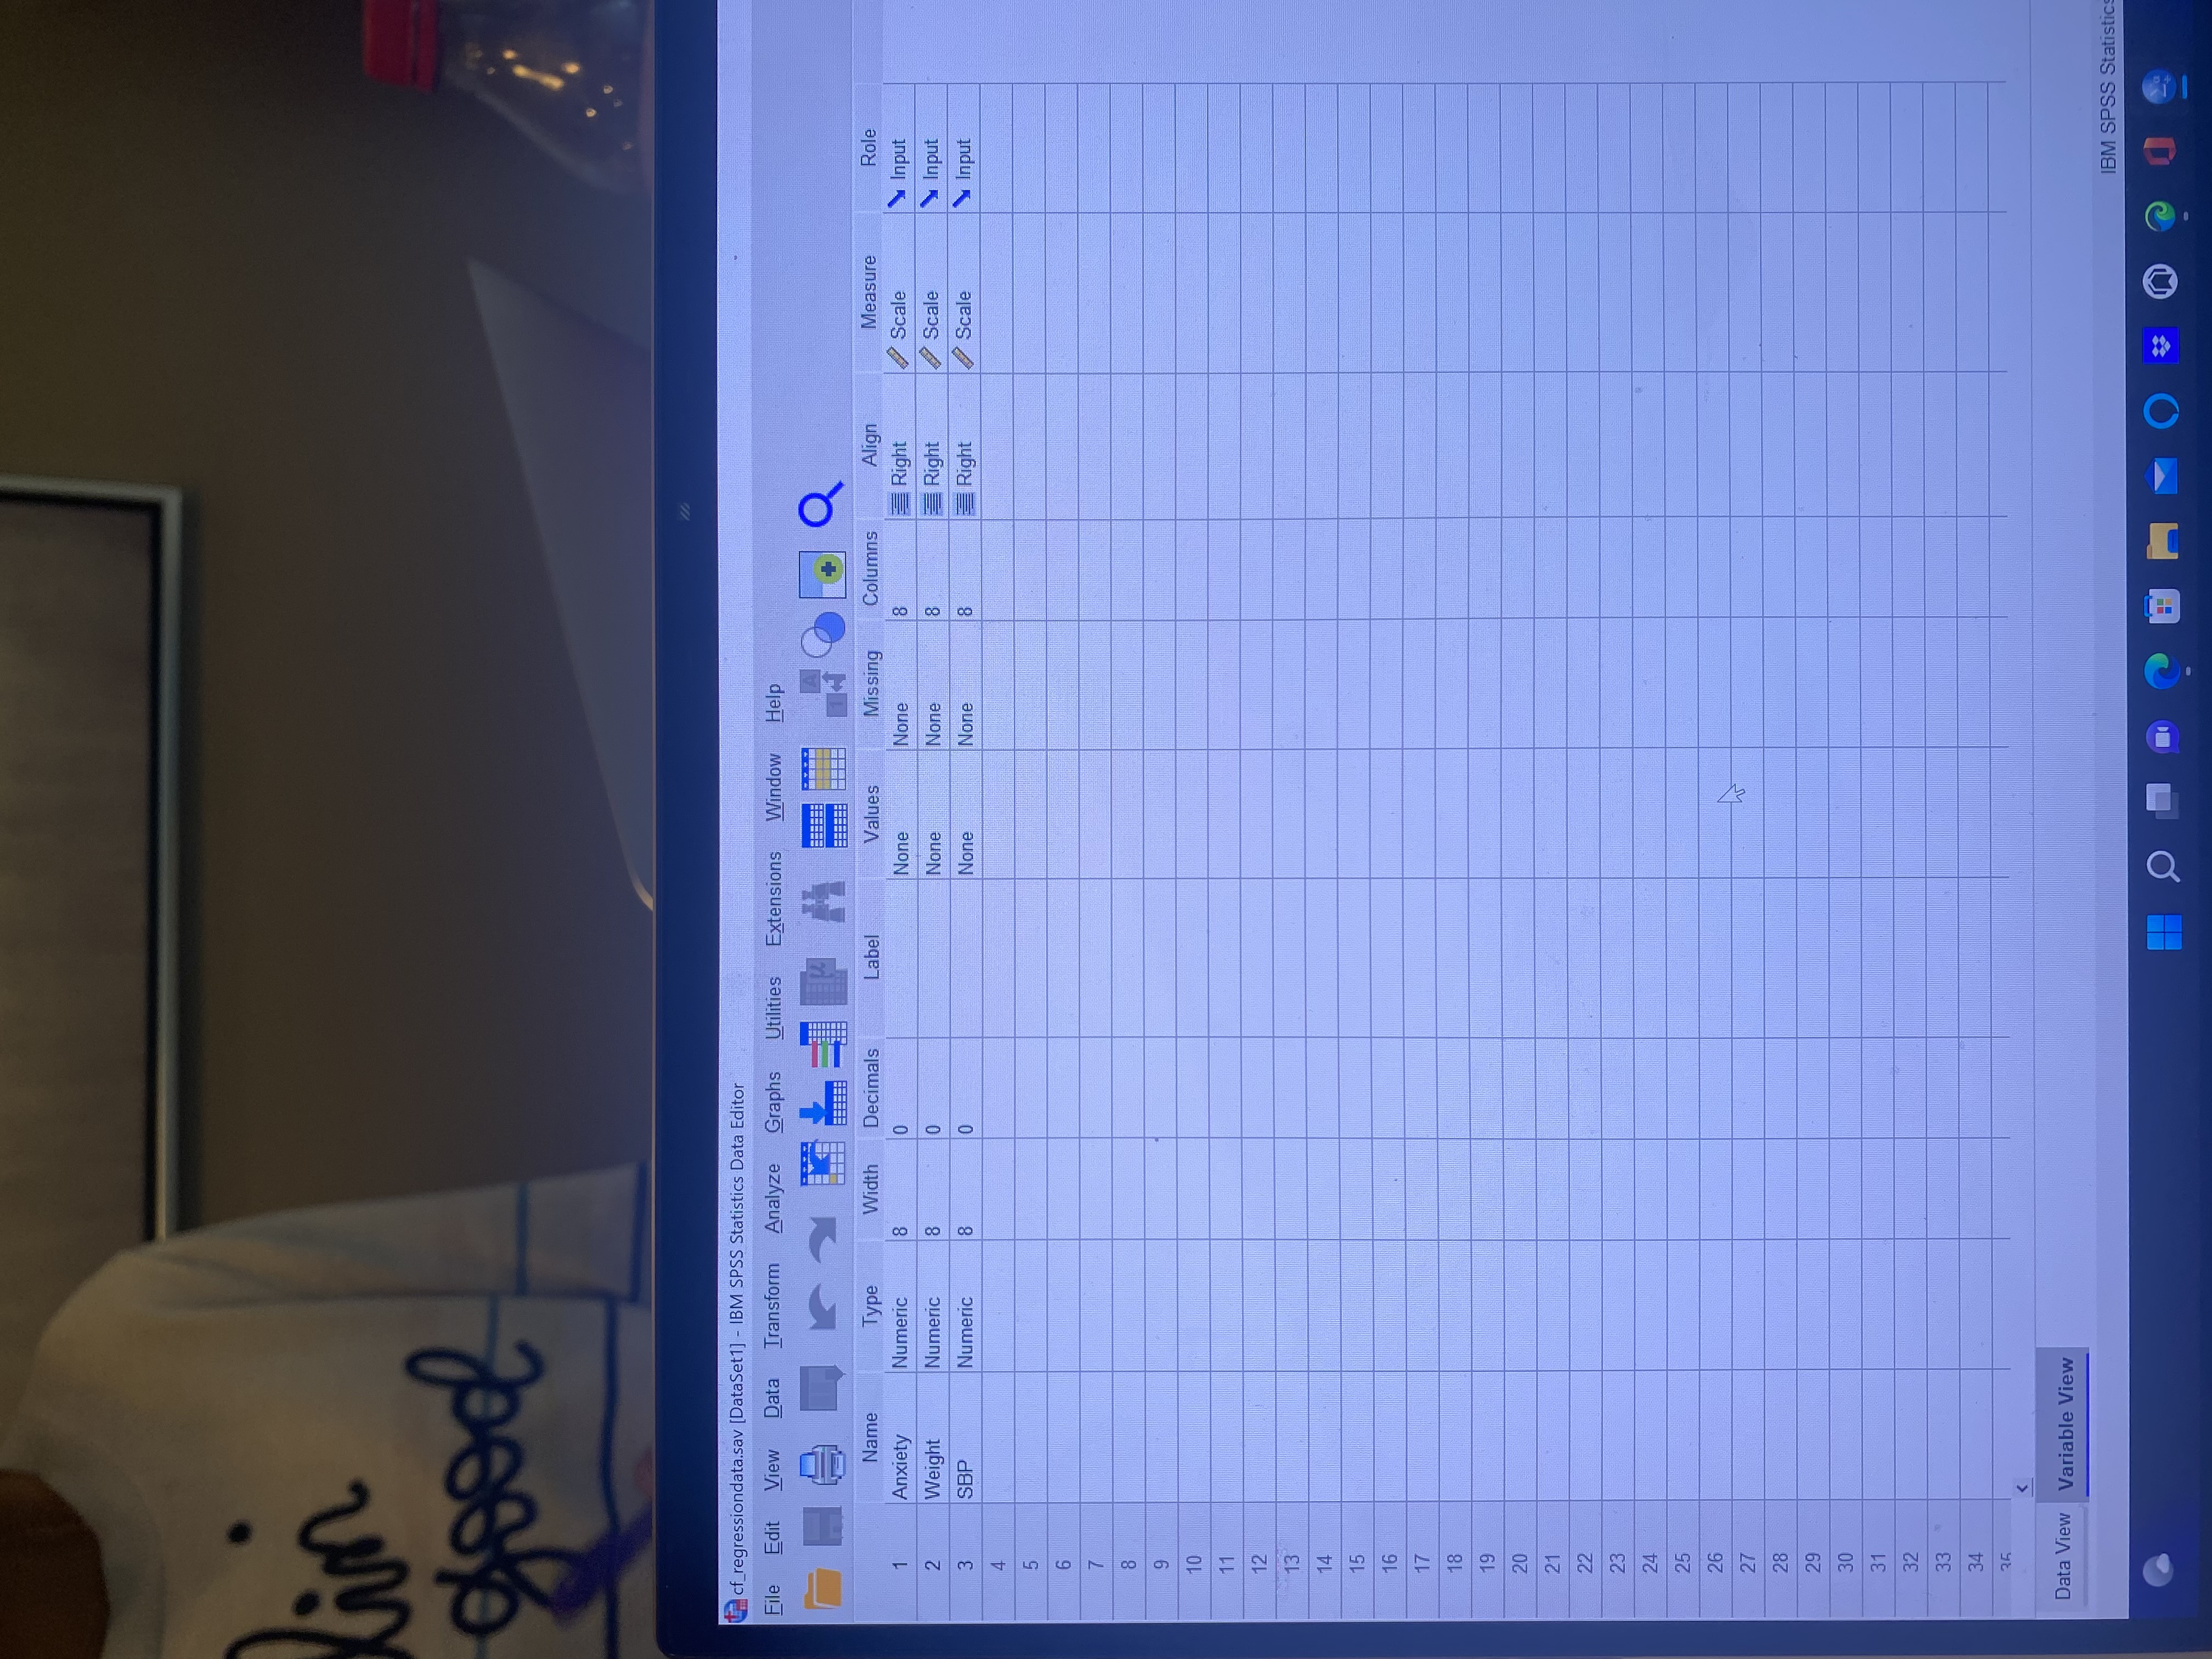
Write Section 1 of the DAA. Provide a context of the Regression Dataset. Specifically, imagine that you are a health researcher studying how well a measure of anxiety ( X1) and weight ( X2) predict systolic blood pressure ( Y) . In Section 1 of the DAA, articulate your predictor variables, the outcome variable, and the scales of measurement for each variable. Specify the sample size of the dataset.
Step 2
Write Section 2 of the DAA. Test the four assumptions of multiple regression. Begin with SPSS output of the three histograms on X1, X 2, and Y and provide visual interpretations of normality. Next, paste the SPSS output of the scatterplot matrix and interpret it in terms of linearity and bivariate outliers. Next, paste SPSS output of the zero-order correlations (Pearson r) and interpret it to check the multicollinearity assumption. Note: To test this assumption in SPSS, use Analyze... Correlate... Bivariate Correlations to generate a two-tailed test; do not use the default one-tailed test output from the Linear Regression procedure. Finally, paste the SPSS plot of standardized residuals (ZPRED = x-axis; ZRESID = y-axis) and interpret it to check the homoscedasticity assumption.
Step 3
Write Section 3 of the DAA. Specify a research question for the overall regression model. Articulate a null hypothesis and alternative hypothesis for the overall regression model. Specify a research question for each predictor. Articulate the null hypothesis and alternative hypothesis for each predictor. Specify the alpha level.
Step 4
Write Section 4 of the DAA. Begin with a brief statement reviewing assumptions. Next, paste the SPSS output for the Model Summary. Report R and R2; interpret R2 effect size. Next, paste the SPSS ANOVA output. Report the F test for R and interpret it against the null hypothesis. Next, paste the SPSS Coefficients output. For each predictor, report the b coefficient, the t test results, including interpretation against the null hypothesis, the semipartial squared correlation effect size, and the interpretation of effect size. In your Interpretation section, following Table 11.1 on page 460 of your Applied Statistics text, generate a table of results for the Regression Dataset that summarizes:
- The means and standard deviations of each variable in the regression equation.
- The zero-order (Pearson r) correlations among variables.
- The y-intercept.
- The b coefficients of each predictor with notation of calculated p-values for rejecting the null hypothesis.
- The ? coefficients of each predictor.
- The squared semipartial correlations of each predictor.
- The values of R, R2, and adjusted R2 with notation of p-values for rejecting the null hypothesis.
Step 5
Write Section 5 of the DAA. Discuss your conclusions of the multiple regression as it relates to your stated research questions for the overall regression model and the individual predictors. Conclude with an analysis of the strengths and limitations of multiple regression.
Submit your assignment as a Word document in the assignment area.
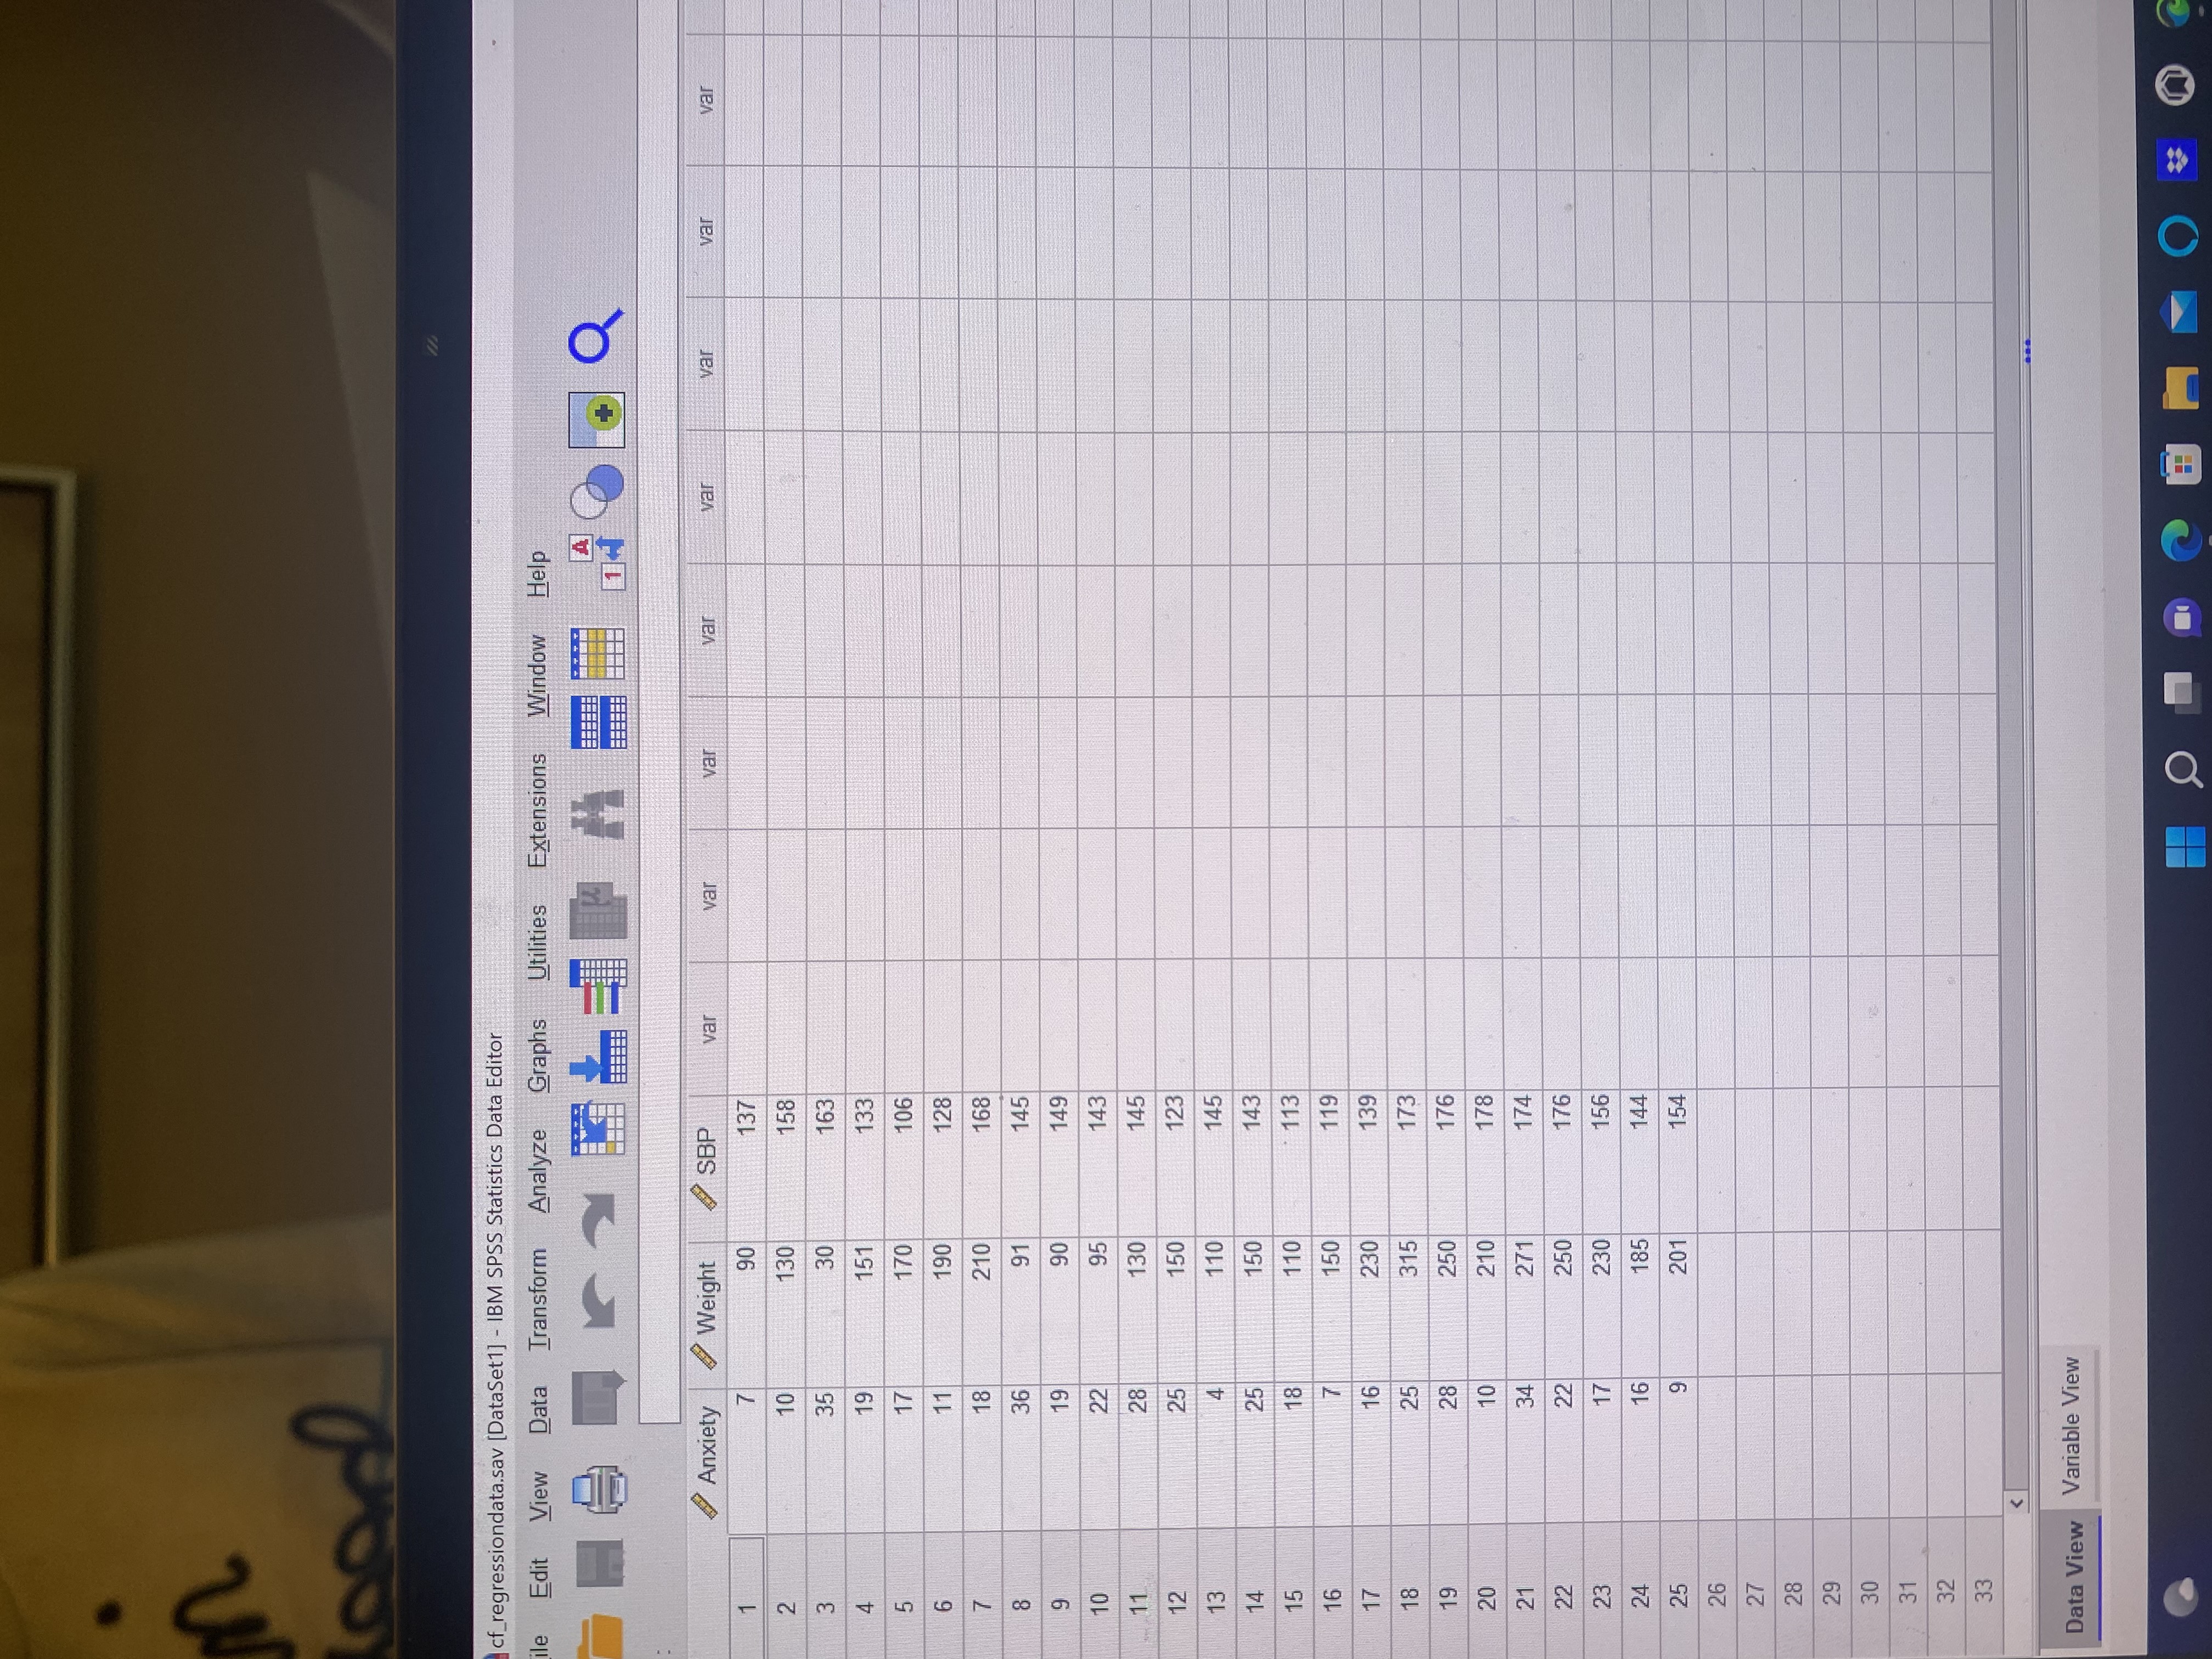

cf_regressiondata.sav [DataSet1] - IBM SPSS Statistics Data Editor ile Edit View Data Transform Analyze Graphs Utilities Extensions Window Help A + Anxiety Weight SBP var var var var var var var var 1 7 90 137 10 130 158 A W N 35 30 163 19 151 133 17 170 106 11 190 128 18 210 168 36 91 145 19 90 149 10 22 95 143 28 130 145 12 25 150 123 4 110 145 14 25 150 143 15 18 110 113 16 150 119 17 16 230 139 18 25 315 173 19 28 250 176 20 10 210 178 21 34 271 174 22 22 250 176 23 17 230 156 24 16 185 144 25 9 201 154 26 27 28 29 30 31 32 33 Data View Variable Viewlin good cf_regressiondata.sav [DataSet1] - IBM SPSS Statistics Data Editor File Edit View Data Transform Analyze Graphs Utilities Extensions Window Help + Align Measure Role Width Decimals Label Values Columns Name Type Missing Scale \\ Input Anxiety Numeric 8 0 None None 18 Right None None 8 Input Weight Numeric 8 Right Scale 8 None None 8 Right Scale Input SBP Numeric 9 29 30 31 32 33 34 Data View Variable View IBM SPSS Statistic
Step by Step Solution
There are 3 Steps involved in it

Get step-by-step solutions from verified subject matter experts