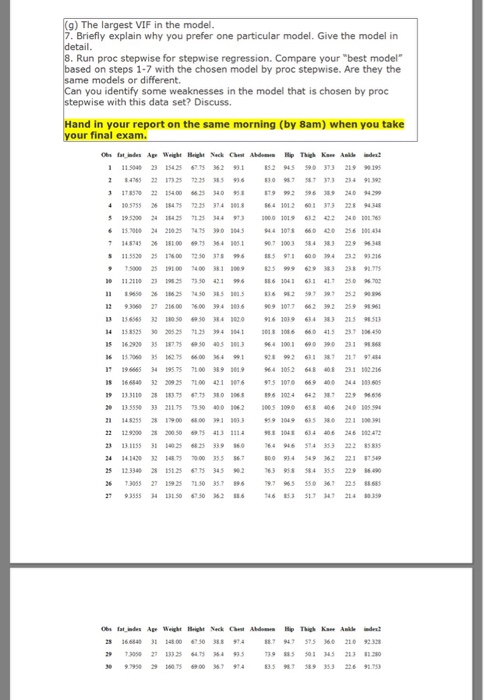
Question: Multiple regression with SAS SAS Program: data; input Obs fat_index Age Weight Height Neck Chest Abdomen Hip Thigh Knee Ankle index2; datalines; 1 11.5040 23

Multiple regression with SAS
SAS Program:
data;
input Obs fat_index Age Weight Height Neck Chest Abdomen Hip Thigh Knee Ankle index2;
datalines;
1 11.5040 23 154.25 67.75 36.2 93.1 85.2 94.5 59.0 37.3 21.9 90.195
2 8.4765 22 173.25 72.25 38.5 93.6 83.0 98.7 58.7 37.3 23.4 91.392
3 17.8570 22 154.00 66.25 34.0 95.8 87.9 99.2 59.6 38.9 24.0 94.299
4 10.5755 26 184.75 72.25 37.4 101.8 86.4 101.2 60.1 37.3 22.8 94.348
5 19.5200 24 184.25 71.25 34.4 97.3 100.0 101.9 63.2 42.2 24.0 101.765
6 15.7010 24 210.25 74.75 39.0 104.5 94.4 107.8 66.0 42.0 25.6 101.434
7 14.8745 26 181.00 69.75 36.4 105.1 90.7 100.3 58.4 38.3 22.9 96.348
8 11.5520 25 176.00 72.50 37.8 99.6 88.5 97.1 60.0 39.4 23.2 93.216
9 7.5000 25 191.00 74.00 38.1 100.9 82.5 99.9 62.9 38.3 23.8 91.775
10 11.2110 23 198.25 73.50 42.1 99.6 88.6 104.1 63.1 41.7 25.0 96.702
11 8.9650 26 186.25 74.50 38.5 101.5 83.6 98.2 59.7 39.7 25.2 90.896
12 9.3060 27 216.00 76.00 39.4 103.6 90.9 107.7 66.2 39.2 25.9 98.961
13 15.6565 32 180.50 69.50 38.4 102.0 91.6 103.9 63.4 38.3 21.5 98.513
14 15.8525 30 205.25 71.25 39.4 104.1 101.8 108.6 66.0 41.5 23.7 106.450
15 16.2920 35 187.75 69.50 40.5 101.3 96.4 100.1 69.0 39.0 23.1 98.868
16 15.7060 35 162.75 66.00 36.4 99.1 92.8 99.2 63.1 38.7 21.7 97.484
17 19.6665 34 195.75 71.00 38.9 101.9 96.4 105.2 64.8 40.8 23.1 102.216
18 16.6840 32 209.25 71.00 42.1 107.6 97.5 107.0 66.9 40.0 24.4 103.605
19 13.3110 28 183.75 67.75 38.0 106.8 89.6 102.4 64.2 38.7 22.9 96.656
20 13.5550 33 211.75 73.50 40.0 106.2 100.5 109.0 65.8 40.6 24.0 105.594
21 14.8255 28 179.00 68.00 39.1 103.3 95.9 104.9 63.5 38.0 22.1 100.391
22 12.9200 28 200.50 69.75 41.3 111.4 98.8 104.8 63.4 40.6 24.6 102.472
23 13.1155 31 140.25 68.25 33.9 86.0 76.4 94.6 57.4 35.3 22.2 85.835
24 14.1420 32 148.75 70.00 35.5 86.7 80.0 93.4 54.9 36.2 22.1 87.549
25 12.3340 28 151.25 67.75 34.5 90.2 76.3 95.8 58.4 35.5 22.9 86.490
26 7.3055 27 159.25 71.50 35.7 89.6 79.7 96.5 55.0 36.7 22.5 88.685
27 9.3555 34 131.50 67.50 36.2 88.6 74.6 85.3 51.7 34.7 21.4 80.359
28 16.6840 31 148.00 67.50 38.8 97.4 88.7 94.7 57.5 36.0 21.0 92.328
29 7.3050 27 133.25 64.75 36.4 93.5 73.9 88.5 50.1 34.5 21.3 81.280
30 9.7950 29 160.75 69.00 36.7 97.4 83.5 98.7 58.9 35.3 22.6 91.753
 Multiple regression with SAS SAS Program: data; input Obs fat_index Age
Weight Height Neck Chest Abdomen Hip Thigh Knee Ankle index2; datalines; 1

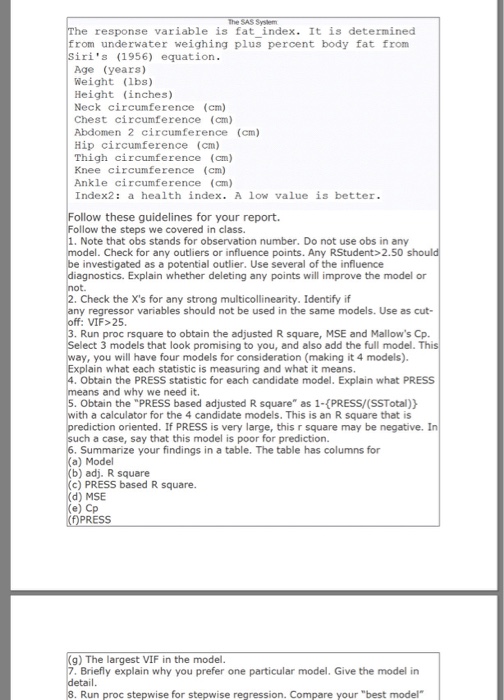
SAS response variable is fat_index. It is determined fr underwater weighing plus percent body fat from iri's (1956) equation Age (years) Weight (lbs) Height (inches) Neck circumference (cm) Chest circumference (cm) Abdomen 2 circumference (cm) Hip circumference (cm) Thigh circumference () Knee circumference (cm) Ankle circumference (cm) Index2: a health index. A low value is better. ollow these guidelines for your report. the steps we covered in class. Note that obs stands for observation number. Do not use obs in any I. Check for any outliers or influence points. Any RStudent> 2.50 e investigated as a potential outlier. Use several of the influence Explain whether deleting any points will improve the model or Check the X's for any strong multicollinearity. Identify if y regressor variables should not be used in the same models. Use as cut- :VIF> 25 Run proc rsquare to obtain the adjusted R square, MSE and Mallow's Cp. 3 models that look promising to you, and also add the full model ay, you will have four models for consideration (making it 4 models) Explain what each statistic is measuring and what it means. Obtain the PRESS statistic for each candidate model. Explain what PRESS and why we need it. Obtain the "PRESS based adjusted R square" as 1-(PRESS/(SSTotal)) ith a calculator for the 4 candidate models. This is an R square that is n oriented. If PRESS is very large, this r square may be negative. I a case, say that this model is poor for prediction. Summarize your findings in a table. The table has columns for a) Model b) adj. R square c) PRESS based R square. d) MSE e) Cp PRESS g) The largest VIF in the model Briefly explain why you prefer one particular model. Give the model in Run proc stepwise for stepwise regression. Compare your "best model

Step by Step Solution

There are 3 Steps involved in it

1 Expert Approved Answer
Step: 1 Unlock blur-text-image
Question Has Been Solved by an Expert!

Get step-by-step solutions from verified subject matter experts

Step: 2 Unlock
Step: 3 Unlock

Students Have Also Explored These Related Databases Questions!