

Question: Multivariate statistical analysis using R or SAS. 1. Consider identifying the neurotic state of an individual referred for psy- chiatric examination. Three measurements A, B,
Multivariate statistical analysis using R or SAS.
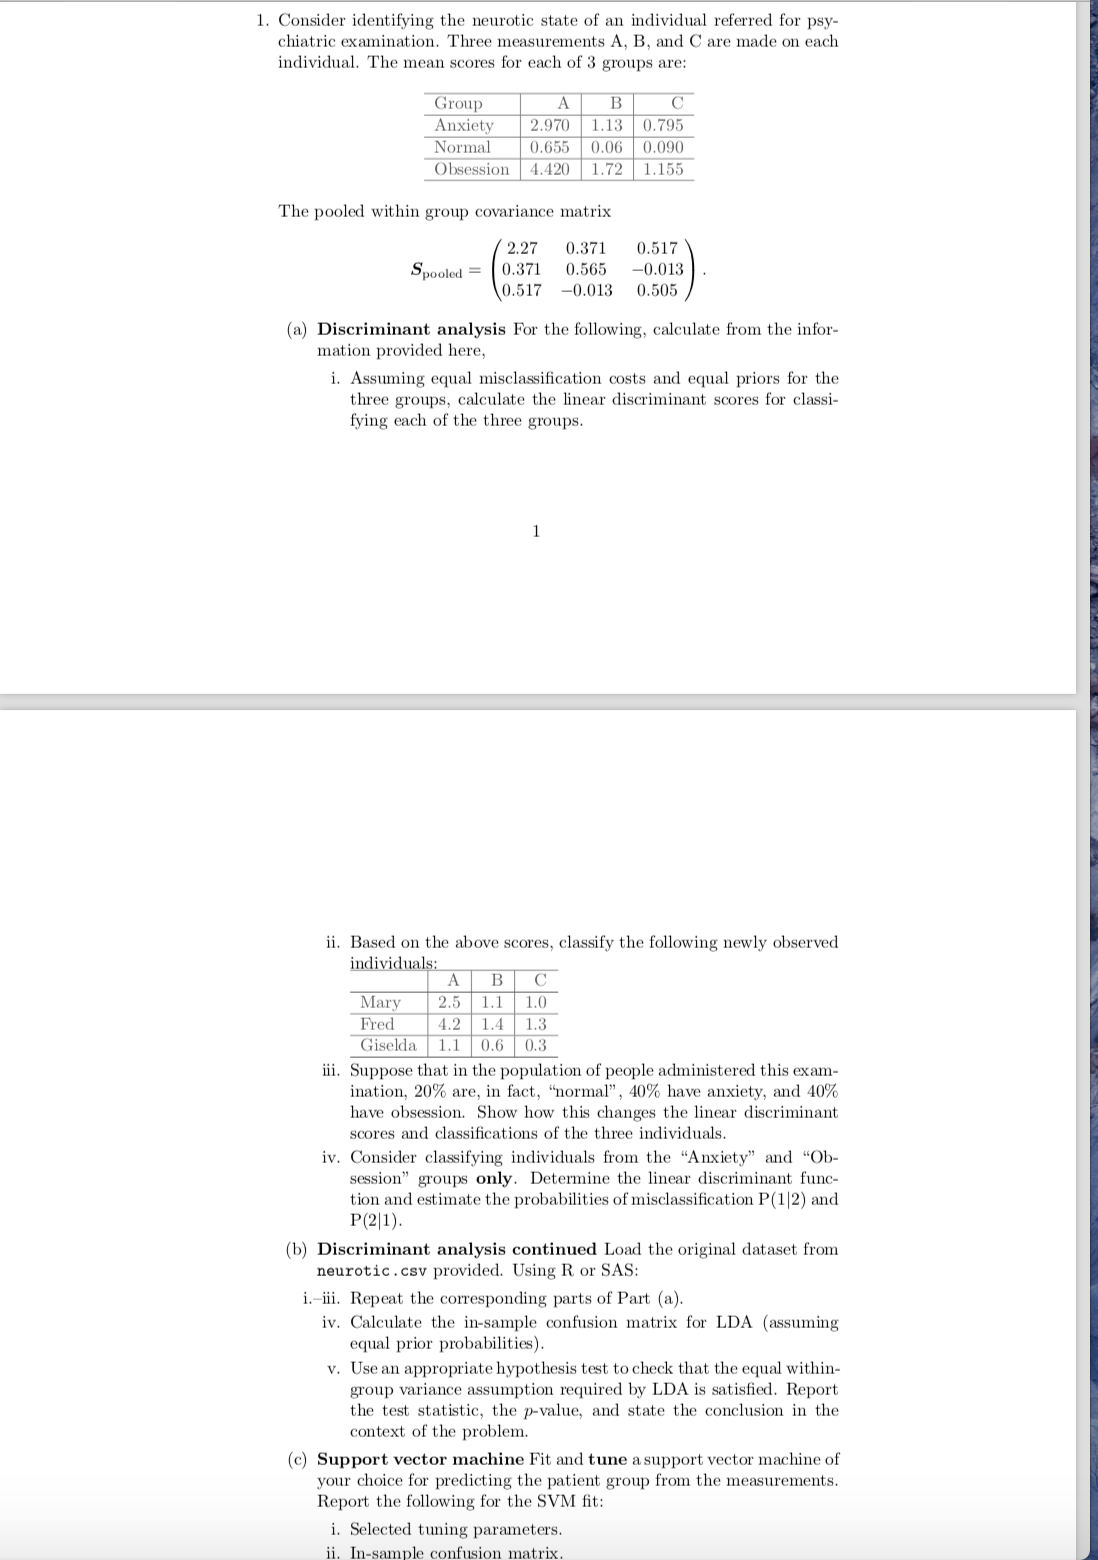
1. Consider identifying the neurotic state of an individual referred for psy- chiatric examination. Three measurements A, B, and C are made on each individual. The mean scores for each of 3 groups are: Group A B C Anxiety 2.970 1.13 0.795 Normal 0.655 0.06 0.090 Obsession 4.420 1.72 1.155 The pooled within group covariance matrix 2.27 0.371 0.517 Spooled = 0.371 0.565 -0.013 0.517 -0.013 0.505 (a) Discriminant analysis For the following, calculate from the infor- mation provided here, i. Assuming equal misclassification costs and equal priors for the three groups, calculate the linear discriminant scores for classi- fying each of the three groups. ii. Based on the above scores, classify the following newly observed individuals: A BC Mary 2.5 1.1 1.0 Fred 4.2 1.4 1.3 Giselda 1.1 0.6 0.3 iii. Suppose that in the population of people administered this exam- ination, 20% are, in fact, "normal", 40% have anxiety, and 40% have obsession. Show how this changes the linear discriminant scores and classifications of the three individuals. iv. Consider classifying individuals from the "Anxiety" and "Ob- session" groups only. Determine the linear discriminant func- P(2|1). tion and estimate the probabilities of misclassification P(1/2) and (b) Discriminant analysis continued Load the original dataset from neurotic . csv provided. Using R or SAS: i.-iii. Repeat the corresponding parts of Part (a). iv. Calculate the in-sample confusion matrix for LDA (assuming equal prior probabilities). v. Use an appropriate hypothesis test to check that the equal within- group variance assumption required by LDA is satisfied. Report the test statistic, the p-value, and state the conclusion in the context of the problem. (c) Support vector machine Fit and tune a support vector machine of your choice for predicting the patient group from the measurements. Report the following for the SVM fit: i. Selected tuning parameters
Step by Step Solution
There are 3 Steps involved in it

Get step-by-step solutions from verified subject matter experts