

Question: Murray Corp. reported the following on its comparative income statement: (Click the icon to view the data.) Prepare a horizontal analysis of revenues and gross
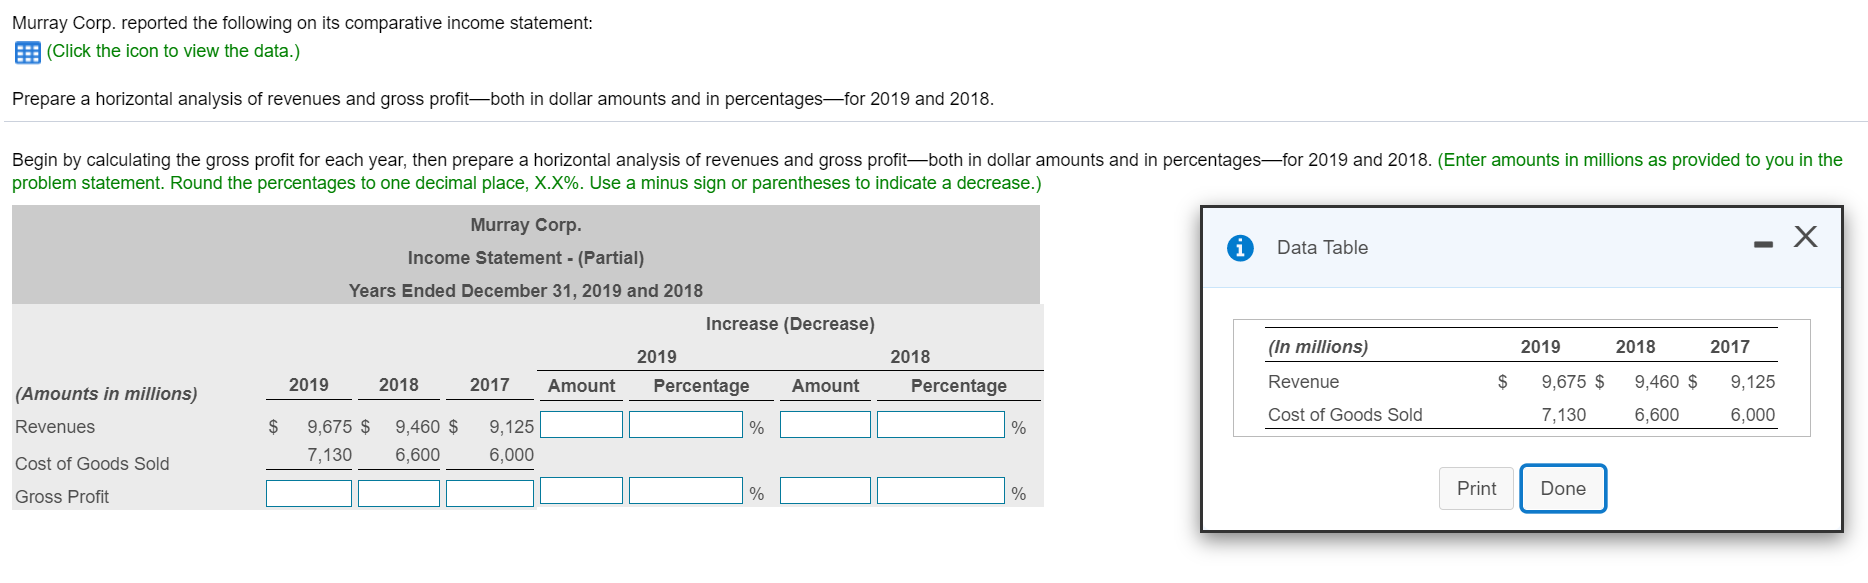
Murray Corp. reported the following on its comparative income statement: (Click the icon to view the data.) Prepare a horizontal analysis of revenues and gross profitboth in dollar amounts and in percentagesfor 2019 and 2018. Begin by calculating the gross profit for each year, then prepare a horizontal analysis of revenues and gross profitboth in dollar amounts and in percentagesfor 2019 and 2018. (Enter amounts in millions as provided to you in the problem statement. Round the percentages to one decimal place, X.X%. Use a minus sign or parentheses to indicate a decrease.) Data Table Murray Corp. Income Statement - (Partial) Years Ended December 31, 2019 and 2018 Increase (Decrease) 2019 2018 2017 Amount Percentage Amount 2019 (In millions) 2018 2017 2018 2019 Percentage Revenue $ 9,675 $ 9,460 $ (Amounts in millions) 9,125 Cost of Goods Sold 7,130 6,600 6,000 Revenues $ % % 9,675 $ 7,130 9,460 $ 6,600 9,125 6,000 Cost of Goods Sold Gross Profit % % Print Done
Step by Step Solution
There are 3 Steps involved in it

Get step-by-step solutions from verified subject matter experts