

Question: Must be in R programming 2.1 Use R to define a data sequence t-seq (2015, 2018, length 100), and then plot the following two functions
Must be in R programming 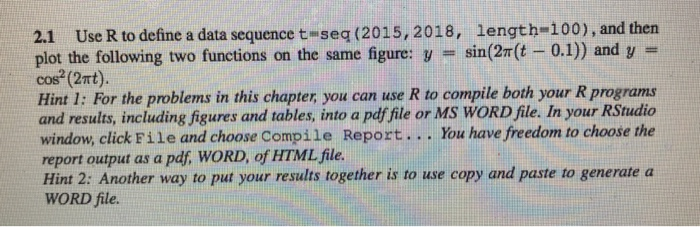
2.1 Use R to define a data sequence t-seq (2015, 2018, length 100), and then plot the following two functions on the same figure: ysin(2(t-0.1) and y- cos (2mt). Hint 1: For the problems in this chapter, you can use R to compile both your R programs and results, including figures and tables, into a pdf file or MS WORD file. In your RStudio window, click File and choose Compile Report.. You have freedom to choose the report output as a pdf WORD, of HTML file. Hint 2: Another way to put your results together is to use copy and paste to generate a WORD file
Step by Step Solution
There are 3 Steps involved in it
1 Expert Approved Answer
Step: 1 Unlock

Question Has Been Solved by an Expert!
Get step-by-step solutions from verified subject matter experts
Step: 2 Unlock
Step: 3 Unlock