

Question: Must be solved in R please include all libraries and code used to solve the question data(cereal) just solve question 4.10 I included Q 1.19
Must be solved in R
please include all libraries and code used to solve the question
data(cereal)
just solve question 4.10
I included Q 1.19 as it is referred to by the question
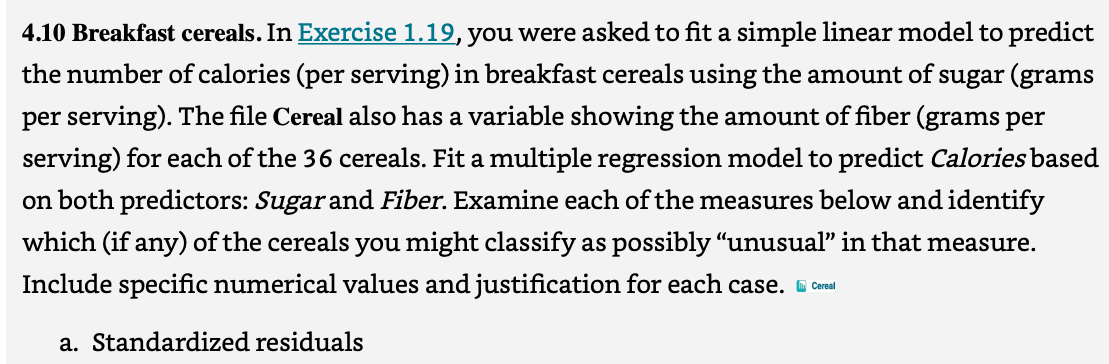
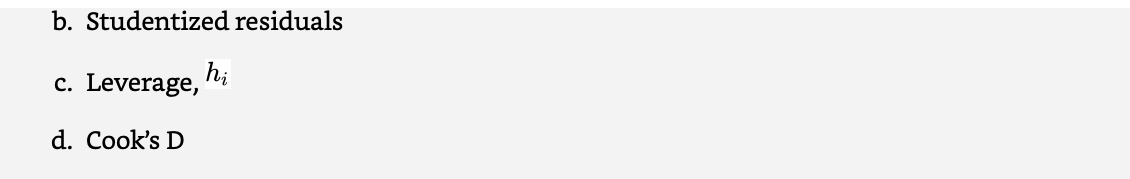
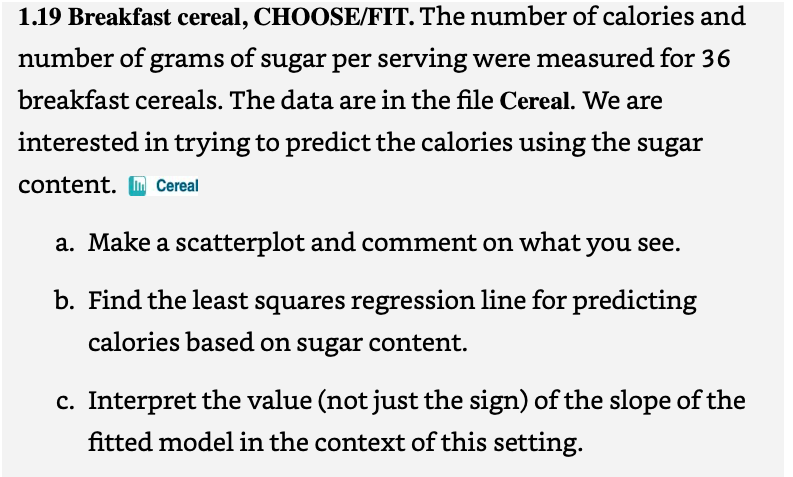
4.10 Breakfast cereals. In Exercise 1.19, you were asked to fit a simple linear model to predict the number of calories (per serving) in breakfast cereals using the amount of sugar (grams per serving). The file Cereal also has a variable showing the amount of fiber (grams per serving) for each of the 36 cereals. Fit a multiple regression model to predict Calories based on both predictors: Sugarand Fiber. Examine each of the measures below and identify which (if any) of the cereals you might classify as possibly unusual in that measure. Include specific numerical values and justification for each case. cereal a. Standardized residuals b. Studentized residuals c. Leverage, hi d. Cook's D 1.19 Breakfast cereal, CHOOSE/FIT. The number of calories and number of grams of sugar per serving were measured for 36 breakfast cereals. The data are in the file Cereal. We are interested in trying to predict the calories using the sugar content. Cereal a. Make a scatterplot and comment on what you see. b. Find the least squares regression line for predicting calories based on sugar content. c. Interpret the value (not just the sign) of the slope of the fitted model in the context of this setting. 4.10 Breakfast cereals. In Exercise 1.19, you were asked to fit a simple linear model to predict the number of calories (per serving) in breakfast cereals using the amount of sugar (grams per serving). The file Cereal also has a variable showing the amount of fiber (grams per serving) for each of the 36 cereals. Fit a multiple regression model to predict Calories based on both predictors: Sugarand Fiber. Examine each of the measures below and identify which (if any) of the cereals you might classify as possibly unusual in that measure. Include specific numerical values and justification for each case. cereal a. Standardized residuals b. Studentized residuals c. Leverage, hi d. Cook's D 1.19 Breakfast cereal, CHOOSE/FIT. The number of calories and number of grams of sugar per serving were measured for 36 breakfast cereals. The data are in the file Cereal. We are interested in trying to predict the calories using the sugar content. Cereal a. Make a scatterplot and comment on what you see. b. Find the least squares regression line for predicting calories based on sugar content. c. Interpret the value (not just the sign) of the slope of the fitted model in the context of this settingStep by Step Solution
There are 3 Steps involved in it
1 Expert Approved Answer
Step: 1 Unlock

Question Has Been Solved by an Expert!
Get step-by-step solutions from verified subject matter experts
Step: 2 Unlock
Step: 3 Unlock