

Question: Your team of consultants has been hired by the city of Laramie to help them design an effective bus system. The city has given
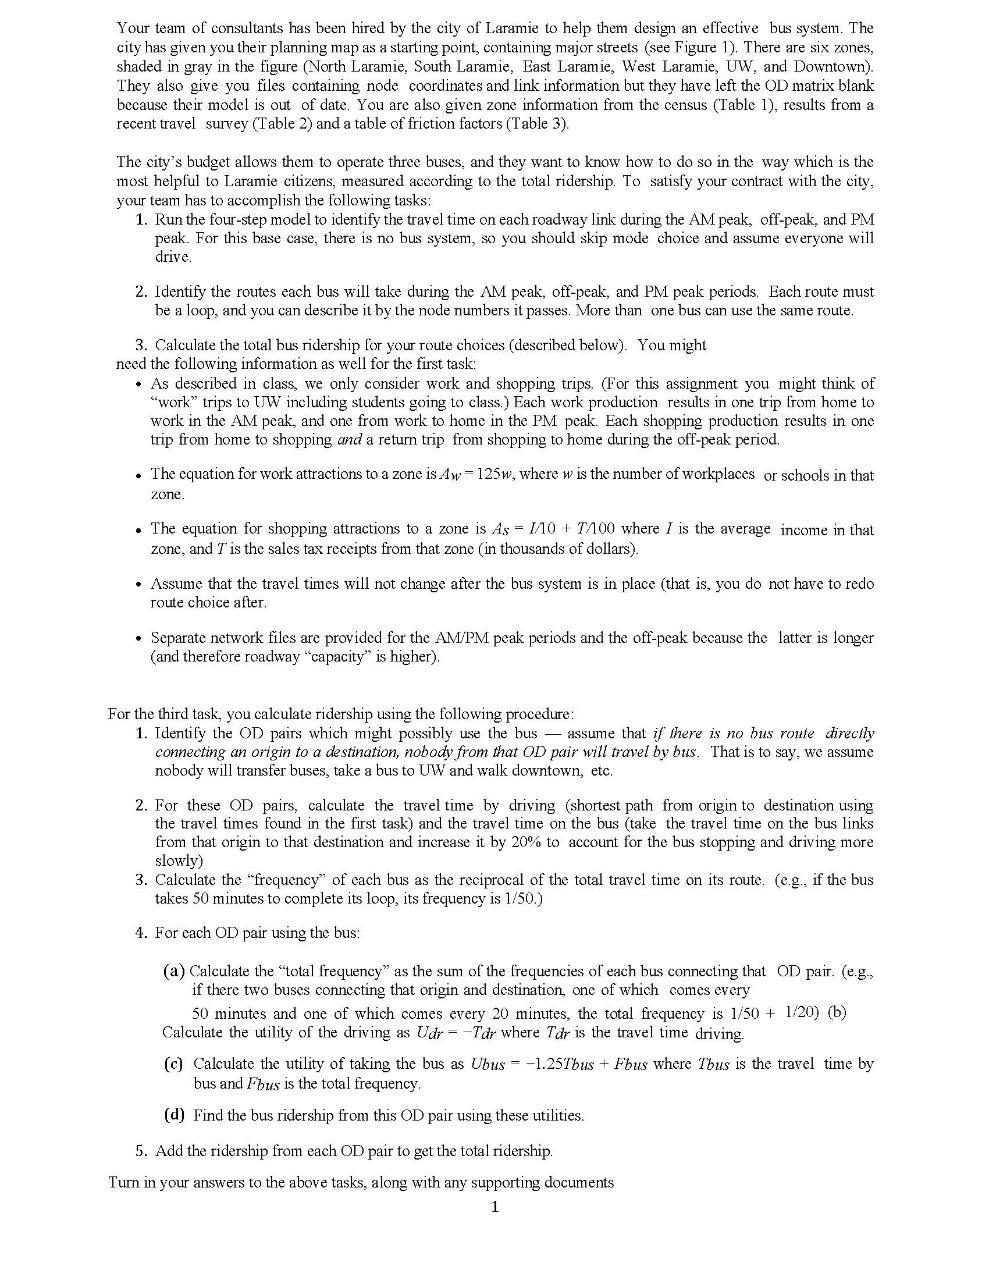
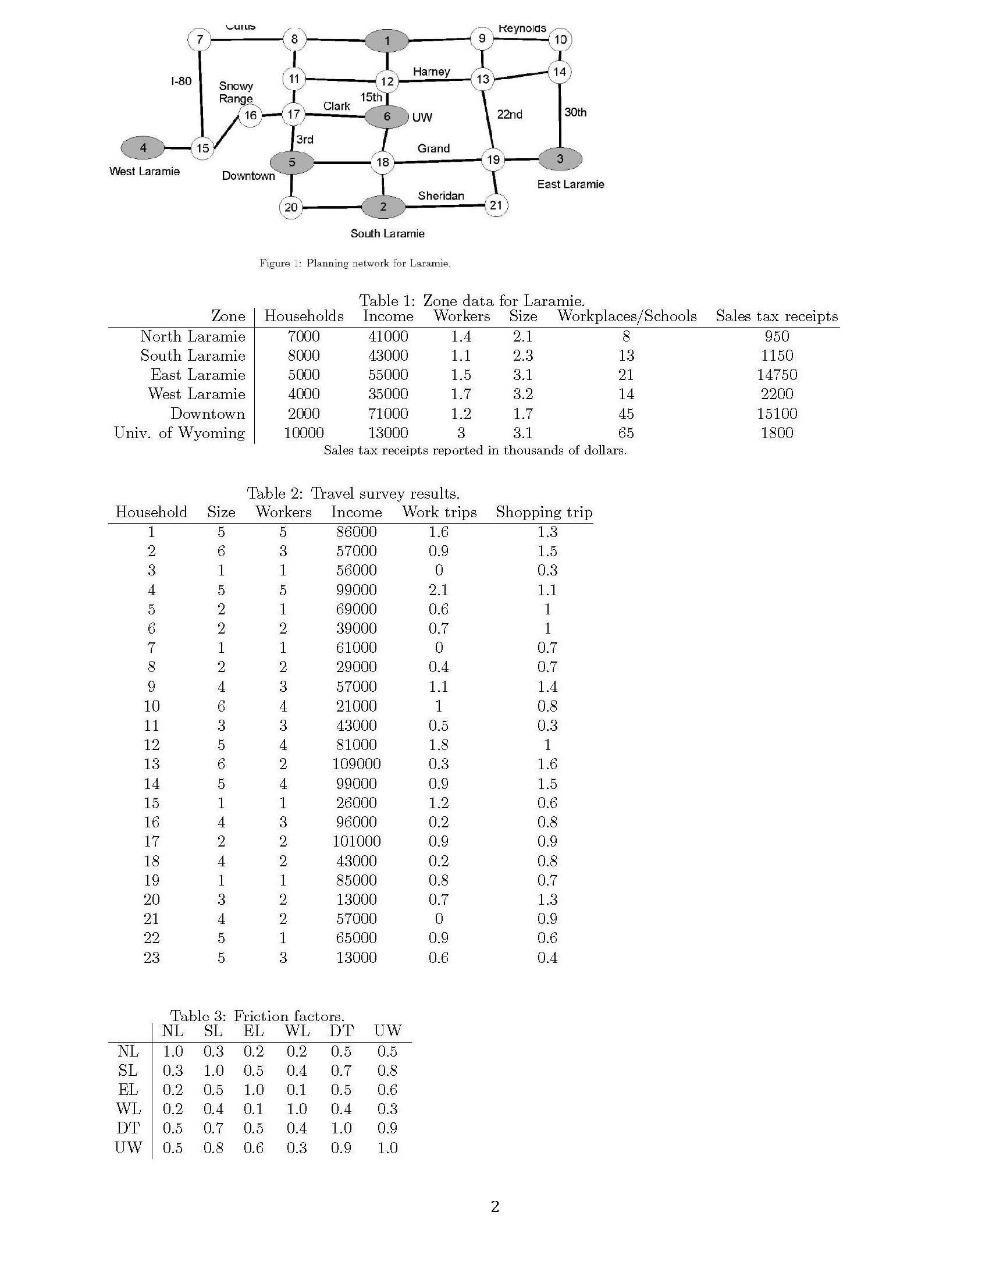
Your team of consultants has been hired by the city of Laramie to help them design an effective bus system. The city has given you their planning map as a starting point, containing major streets (see Figure 1). There are six zones, shaded in gray in the figure (North Laramie, South Laramie, East Laramie, West Laramie, UW, and Downtown). They also give you files containing node coordinates and link information but they have left the OD matrix blank because their model is out of date. You are also given zone information from the census (Table 1), results from a recent travel survey (Table 2) and a table of friction factors (Table 3). The city's budget allows them to operate three buses, and they want to know how to do so in the way which is the most helpful to Laramie citizens, measured according to the total ridership. To satisfy your contract with the city, your team has to accomplish the following tasks: 1. Run the four-step model to identify the travel time on each roadway link during the AM peak, off-peak, and PM peak. For this base case, there is no bus system, so you should skip mode choice and assume everyone will drive. 2. Identify the routes each bus will take during the AM peak, off-peak, and PM peak periods. Each route must be a loop, and you can describe it by the node numbers it passes. More than one bus can use the same route. 3. Calculate the total bus ridership for your route choices (described below). You might need the following information as well for the first task: As described in class, we only consider work and shopping trips. (For this assignment you might think of "work" trips to UW including students going to class.) Each work production results in one trip from home to work in the AM peak, and one from work to home in the PM peak. Each shopping production results in one trip from home to shopping and a return trip from shopping to home during the off-peak period. The equation for work attractions to a zone is Aw-125w, where w is the number of workplaces or schools in that zone. . The equation for shopping attractions to a zone is As = I10 TA100 where I is the average income in that zone, and I is the sales tax receipts from that zone (in thousands of dollars). Assume that the travel times will not change after the bus system is in place (that is, you do not have to redo route choice after. Separate network files are provided for the AM/PM peak periods and the off-peak because the latter is longer (and therefore roadway "capacity" is higher). For the third task, you calculate ridership using the following procedure: 1. Identify the OD pairs which might possibly use the bus assume that if there is no bus route directly connecting an origin to a destination, nobody from that OD pair will travel by bus. That is to say, we assume nobody will transfer buses, take a bus to UW and walk downtown, etc. 2. For these OD pairs, calculate the travel time by driving (shortest path from origin to destination using the travel times found in the first task) and the travel time on the bus (take the travel time on the bus links from that origin to that destination and increase it by 20% to account for the bus stopping and driving more slowly) 3. Calculate the "frequency" of each bus as the reciprocal of the total travel time on its route. (e.g., if the bus takes 50 minutes to complete its loop, its frequency is 1/50.) 4. For each OD pair using the bus: (a) Calculate the "total frequency" as the sum of the frequencies of each bus connecting that OD pair. (e.g., if there two buses connecting that origin and destination, one of which comes every 50 minutes and one of which comes every 20 minutes, the total frequency is 1/50+ 1/20) (b) Calculate the utility of the driving as Udr-Tdr where Tdr is the travel time driving. (c) Calculate the utility of taking the bus as Ubus -1.25Tbus + Fbus where Thus is the travel time by bus and Fbus is the total frequency. (d) Find the bus ridership from this OD pair using these utilities. 5. Add the ridership from each OD pair to get the total ridership. Turn in your answers to the above tasks, along with any supporting documents 1
Step by Step Solution
3.44 Rating (144 Votes )
There are 3 Steps involved in it
According to the given data If wash dryer is dropped then Revised Operating Income will be Sales Lab... View full answer

Get step-by-step solutions from verified subject matter experts