

Question: Must know the Ferrari 2015 case Do you agree with the financial forecast in Exhibit 8? If so, why? If not, what specific concerns do
 Must know the Ferrari 2015 case
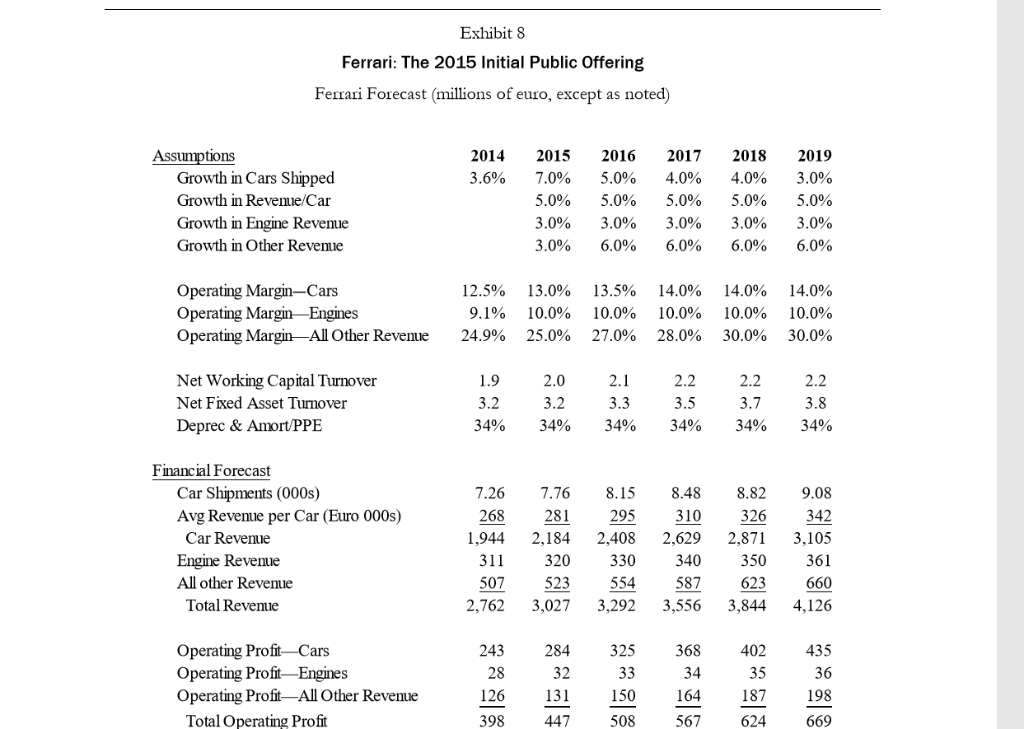
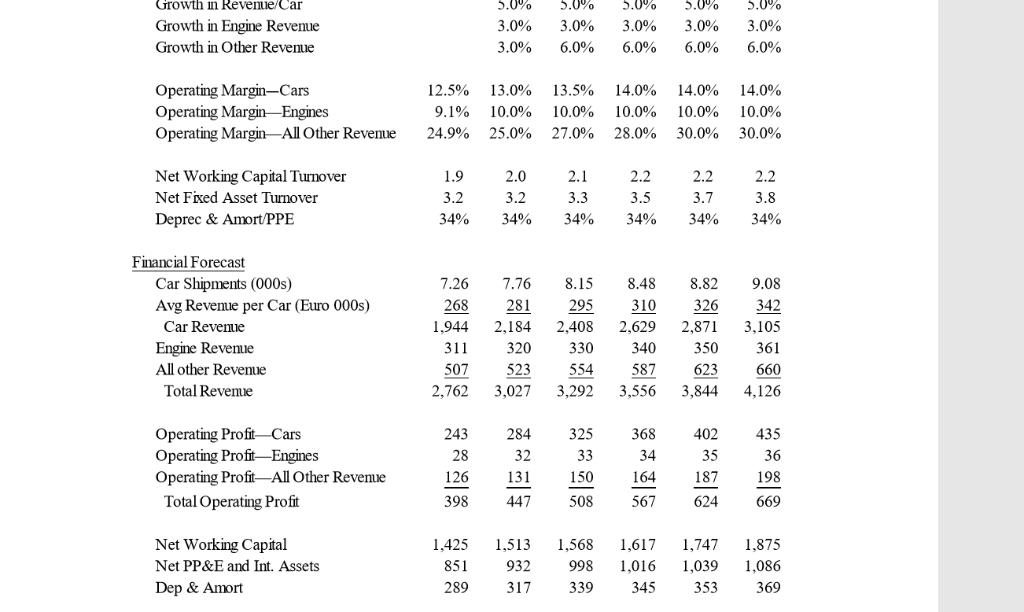
Do you agree with the financial forecast in Exhibit 8? If so, why? If not, what specific concerns do you have?
Exhibit 8 Ferrari: The 2015 Initial Public Offering Ferrari Forecast (millions of euro, except as noted) Assumptions Growth in Cars Shipped 2017 2014 2015 2016 2018 2019 7.0% 3.6% 5.0% 4.0% 3.0% 4.0% Growth in Revemue/Car 5.0% 5.0% 5.0% 5.0% 5.0% Growth in Engine Revenue 3.0% 3.0% 3.0% 3.0% 3.0% Growth in Other Revenue 3.0% 6.0% 6.0% 6.0% 6.0% Operating Margin-Cars Operating Margin-Engines Operating Margin -All Other Revenue 12.5% 13.0% 13.5% 14.0% 14.0% 14.0% 9.1% 10.0% 10.0% 10.0% 10.0% 10.0% 24.9% 25.0% 27.0% 28.0% 30.0% 30.0% Net Working Capital Turnover Net Fixed Asset Turnover 1.9 2.0 2.1 2.2 2.2 2.2 3.2 3.5 3.7 3.2 3.3 3.8 Deprec & Amort/PPE 34% 34% 34% 34% 34% 34% Financial Forecast 9.08 Car Shipments (000s) Avg Revenue per Car (Euro 000s) 7.26 7.76 8.15 8.82 8.48 268 281 295 310 326 342 3,105 2,871 Car Revenue 1,944 2,184 2,408 2,629 Engine Revenue 311 320 330 340 350 361 All other Revenue 507 623 523 554 587 660 Total Revenue 2,762 3,027 3,292 3,556 3,844 4,126 Operating Profit-Cars Operating Profit-Engines Operating Profit-All Other Revenue 243 284 325 368 402 435 28 32 33 34 35 36 126 131 150 164 187 198 Total Operating Profit 398 447 508 567 624 669 Growth in Revenue/Car 5.0% 5.0% 5.0% 5.0% 5.0% Growth in Engine Revemue 3.0% 3.0% 3.0% 3.0% 3.0% Growth in Other Revenue 3.0% 6.0% 6.0% 6.0% 6.0% Operating Margin-Cars Operating Margin-Engines Operating Margin-All Other Revenue 12.5% 13.0% 13.5% 14.0% 14.0% 14.0% 10.0% 9.1% 10.0% 10.0% 10.0% 10.0% 24.9% 25.0% 27.0% 28.0% 30.0% 30.0% Net Working Capital Turnover 1.9 2.0 2.1 2.2 2.2 2.2 Net Fixed Asset Turnover 3.2 3.2 3.3 3.5 3.7 3.8 Deprec & Amort/PPE 34% 34% 34% 34% 34% 34% Financial Forecast Car Shipments (000s) 7.76 8.82 7.26 8.15 8.48 9.08 Avg Revenue per Car (Euro 000s) Car Revenue 268 281 295 310 2,629 326 342 1,944 2,184 2,408 2,871 3,105 Engine Revenue 350 311 320 330 340 361 All other Revenue 523 554 587 660 507 2,762 623 Total Revemue 3,556 4,126 3,027 3,292 3,844 Operating Profit Cars Operating ProfitEngines Operating Profit-All Other Revemue 243 284 325 368 402 435 32 33 34 35 36 28 187 126 131 150 164 198 Total Operating Profit 398 447 508 567 624 669 Net Working Capital 1,425 1,513 1,568 1,617 1,747 1,875 Net PP&E and Int. Assets 851 932 998 1,016 1,039 1,086 289 317 Dep & Amort 339 345 353 369
Step by Step Solution
There are 3 Steps involved in it

Get step-by-step solutions from verified subject matter experts