

Question: **Must use D3 library in JavaScript** Q2: Write a program that reads the data file msl.csv, normalizes the values between 0 and 1, and write
**Must use D3 library in JavaScript** Q2: Write a program that reads the data file msl.csv, normalizes the values between 0 and 1, and write the first row and first column using console.log(). For each x,y coordinate, draw a circle with a radius equal to 5 times the value at that coordinate.
Q3: Find the 25, 50, and 75 percentile values and log those into the console. Color the circles of your previous plot with radii falling within [0-25%], [25%-50%], [50%-75%], [75%-100%] using White, Green, Blue, Red colors, respectively.
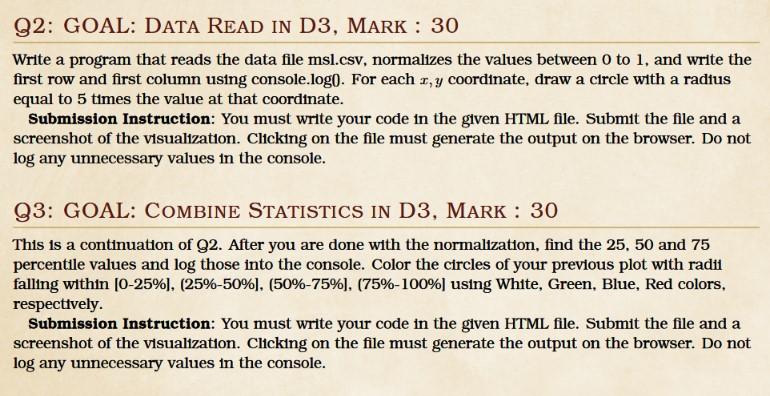
Write a program that reads the data file msl.csv, normalizes the values between 0 to 1 , and write the first row and first column using console.log0. For each x,y coordinate, draw a circle with a radius equal to 5 times the value at that coordinate. Submission Instruction: You must write your code in the given HTML file. Submit the file and a screenshot of the visualization. Clicking on the file must generate the output on the browser. Do not log any unnecessary values in the console. Q3: GOAL: Combine Statistics in D3, MARK : 30 This is a continuation of Q2. After you are done with the normalization, find the 25, 50 and 75 percentile values and log those into the console. Color the circles of your previous plot with radi1 falling within [0-25\%], (25\%-50\%], (50\%-75\%], (75\%-100\%] using White, Green, Blue, Red colors, respecttvely. Submission Instruction: You must write your code in the given HTML file. Submit the file and a screenshot of the visualization. Clicking on the file must generate the output on the browser. Do not log any unnecessary values in the console
Step by Step Solution
There are 3 Steps involved in it

Get step-by-step solutions from verified subject matter experts