

Question: must use gnu prolog language please A hockey puck is moving with a constant velocity across ice. A player hits the puck at time t
must use gnu prolog language please
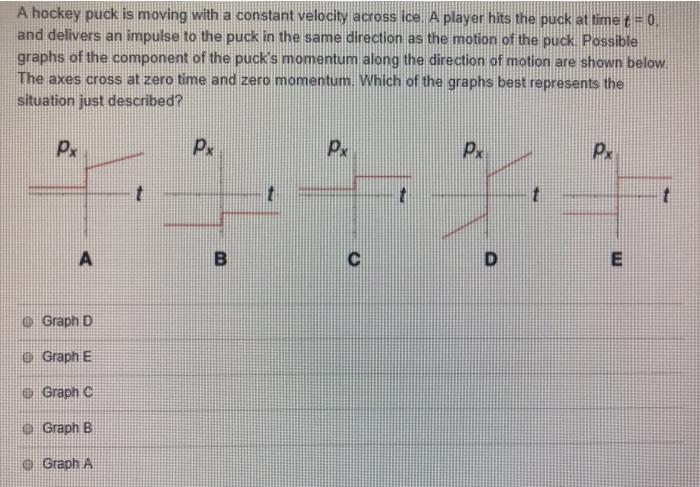
A hockey puck is moving with a constant velocity across ice. A player hits the puck at time t = 0. and delivers an impulse to the puck in the same direction as the motion of the puck. Possible graphs of the component of the puck's momentum along the direction of motion are shown below The axes cross at zero time and zero momentum. Which of the graphs best represents the situation just described? Px Px px px Px t t B D E Graph D Graph E Graph O Graph B Graph A
Step by Step Solution
There are 3 Steps involved in it
1 Expert Approved Answer
Step: 1 Unlock

Question Has Been Solved by an Expert!
Get step-by-step solutions from verified subject matter experts
Step: 2 Unlock
Step: 3 Unlock