

Question: Must use Stata PS2 WS1 Data SS - have to use stata 2. Suppose you have sales data on 5 ounce chocolate bar sales in
Must use Stata
PS2 WS1 Data SS - have to use stata
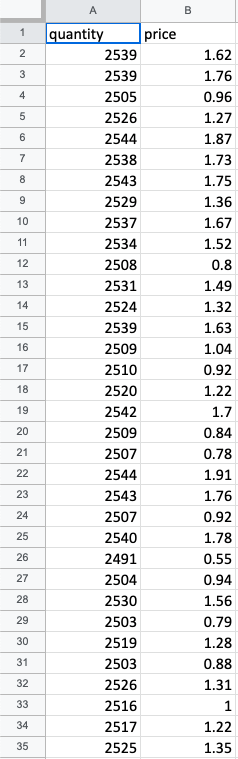
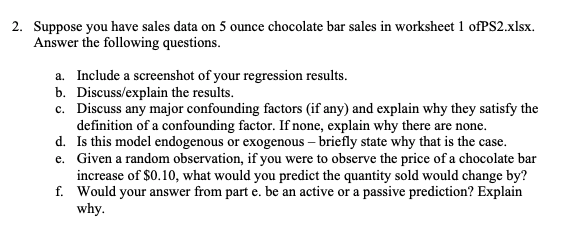
2. Suppose you have sales data on 5 ounce chocolate bar sales in worksheet 1 ofPS2.xlsx. Answer the following questions. a. Include a screenshot of your regression results. b. Discuss/explain the results. c. Discuss any major confounding factors (if any) and explain why they satisfy the definition of a confounding factor. If none, explain why there are none. d. Is this model endogenous or exogenous - briefly state why that is the case. e. Given a random observation, if you were to observe the price of a chocolate bar increase of $0.10, what would you predict the quantity sold would change by? f. Would your answer from part e. be an active or a passive prediction? Explain why. A B 1 2 3 4 5 6 7 8 9 10 11 12 13 14 15 16 17 quantity price 2539 2539 2505 2526 2544 2538 2543 2529 2537 2534 2508 2531 2524 2539 2509 2510 2520 2542 2509 2507 2544 2543 2507 2540 2491 2504 2530 2503 2519 2503 2526 2516 2517 2525 1.62 1.76 0.96 1.27 1.87 1.73 1.75 1.36 1.67 1.52 0.8 1.49 1.32 1.63 1.04 0.92 1.22 1.7 0.84 0.78 1.91 1.76 0.92 1.78 0.55 0.94 1.56 0.79 1.28 0.88 1.31 1 18 19 20 21 22 23 24 25 26 27 28 29 30 31 32 33 34 1.22 35 1.35 2. Suppose you have sales data on 5 ounce chocolate bar sales in worksheet 1 ofPS2.xlsx. Answer the following questions. a. Include a screenshot of your regression results. b. Discuss/explain the results. c. Discuss any major confounding factors (if any) and explain why they satisfy the definition of a confounding factor. If none, explain why there are none. d. Is this model endogenous or exogenous - briefly state why that is the case. e. Given a random observation, if you were to observe the price of a chocolate bar increase of $0.10, what would you predict the quantity sold would change by? f. Would your answer from part e. be an active or a passive prediction? Explain why. A B 1 2 3 4 5 6 7 8 9 10 11 12 13 14 15 16 17 quantity price 2539 2539 2505 2526 2544 2538 2543 2529 2537 2534 2508 2531 2524 2539 2509 2510 2520 2542 2509 2507 2544 2543 2507 2540 2491 2504 2530 2503 2519 2503 2526 2516 2517 2525 1.62 1.76 0.96 1.27 1.87 1.73 1.75 1.36 1.67 1.52 0.8 1.49 1.32 1.63 1.04 0.92 1.22 1.7 0.84 0.78 1.91 1.76 0.92 1.78 0.55 0.94 1.56 0.79 1.28 0.88 1.31 1 18 19 20 21 22 23 24 25 26 27 28 29 30 31 32 33 34 1.22 35 1.35
Step by Step Solution
There are 3 Steps involved in it

Get step-by-step solutions from verified subject matter experts